Sensor Infrastructure in the Smart City
Newcastle University | The Alan Turing Institute
2025-02-25
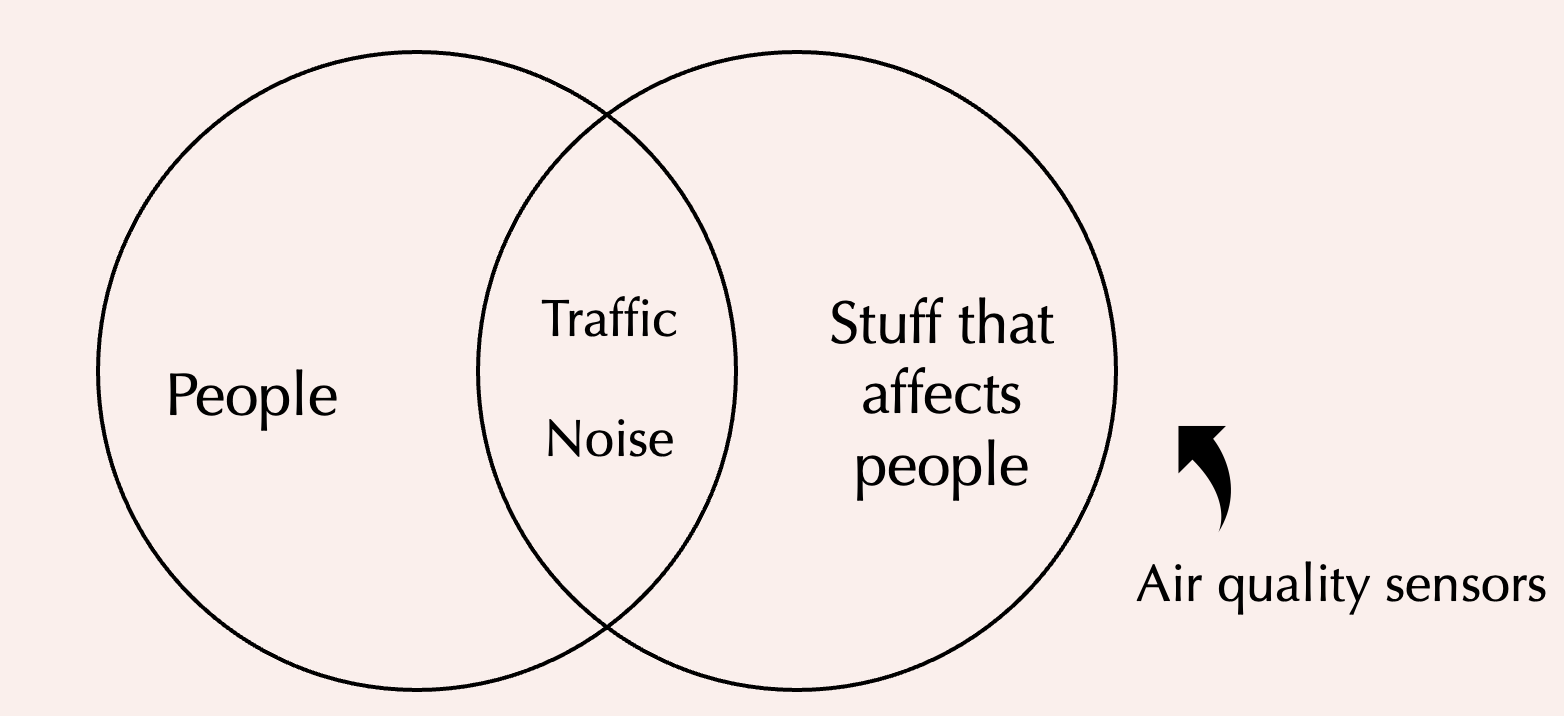
Why care about sensors and sensor networks?
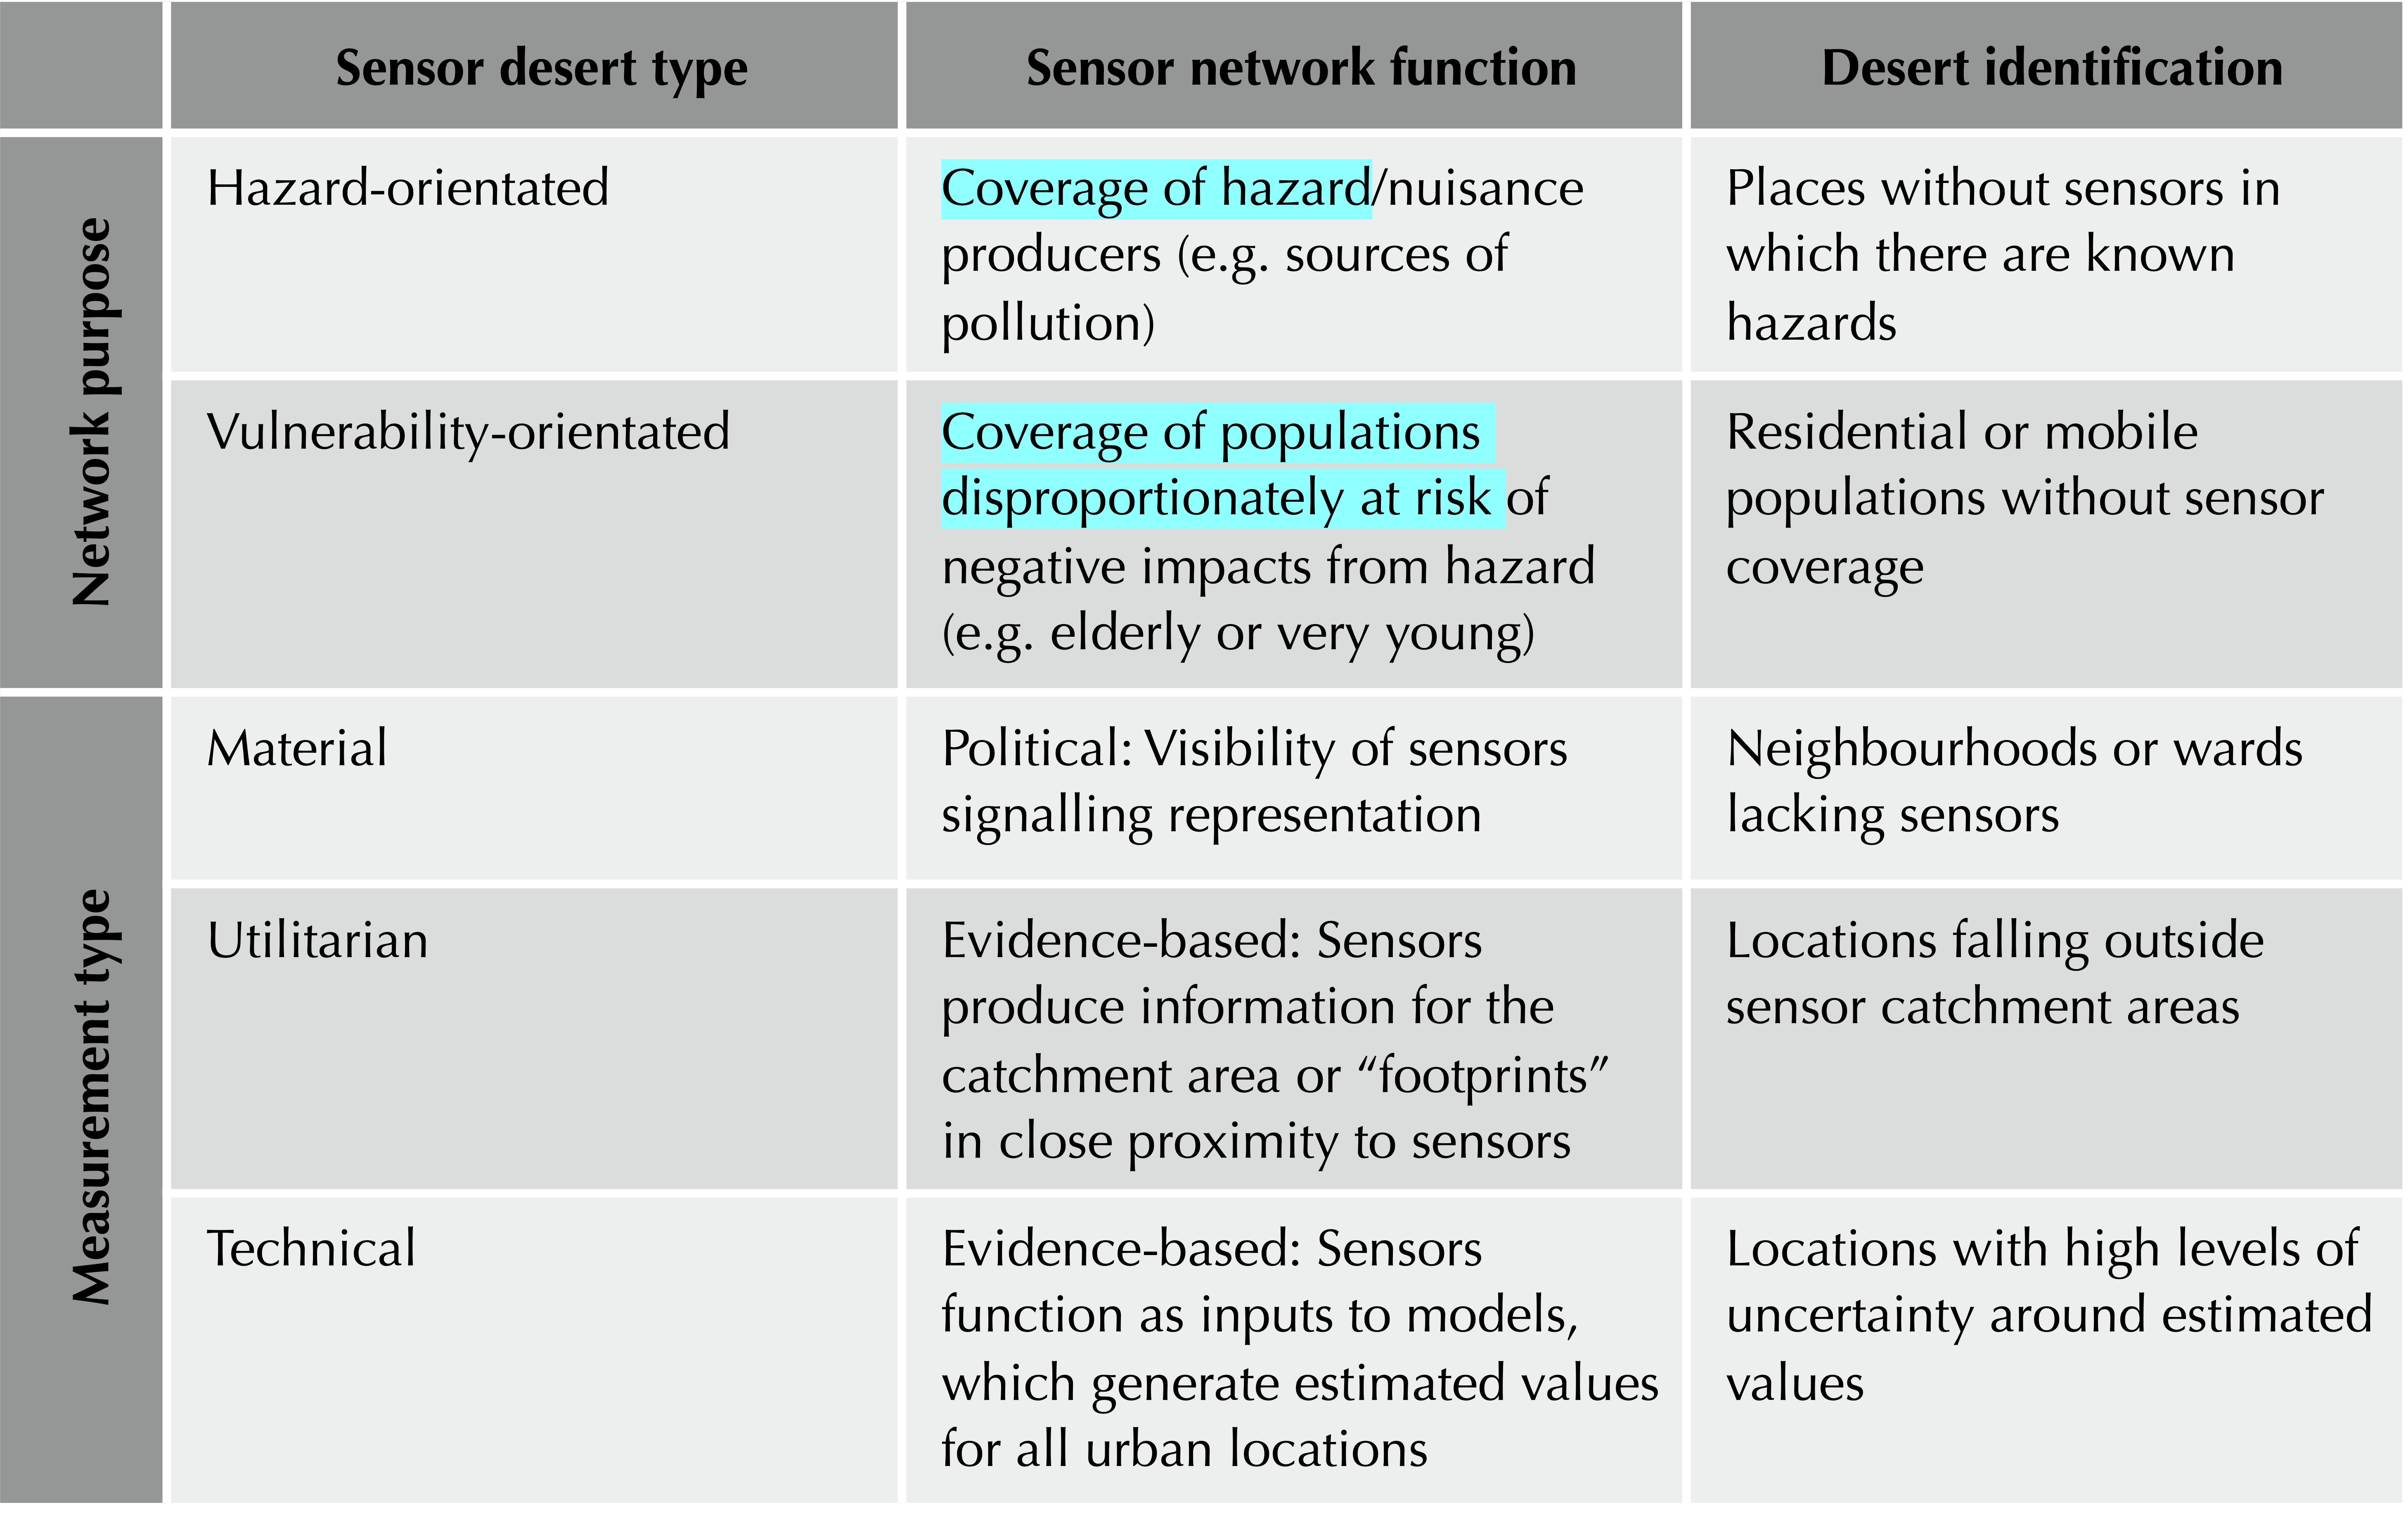
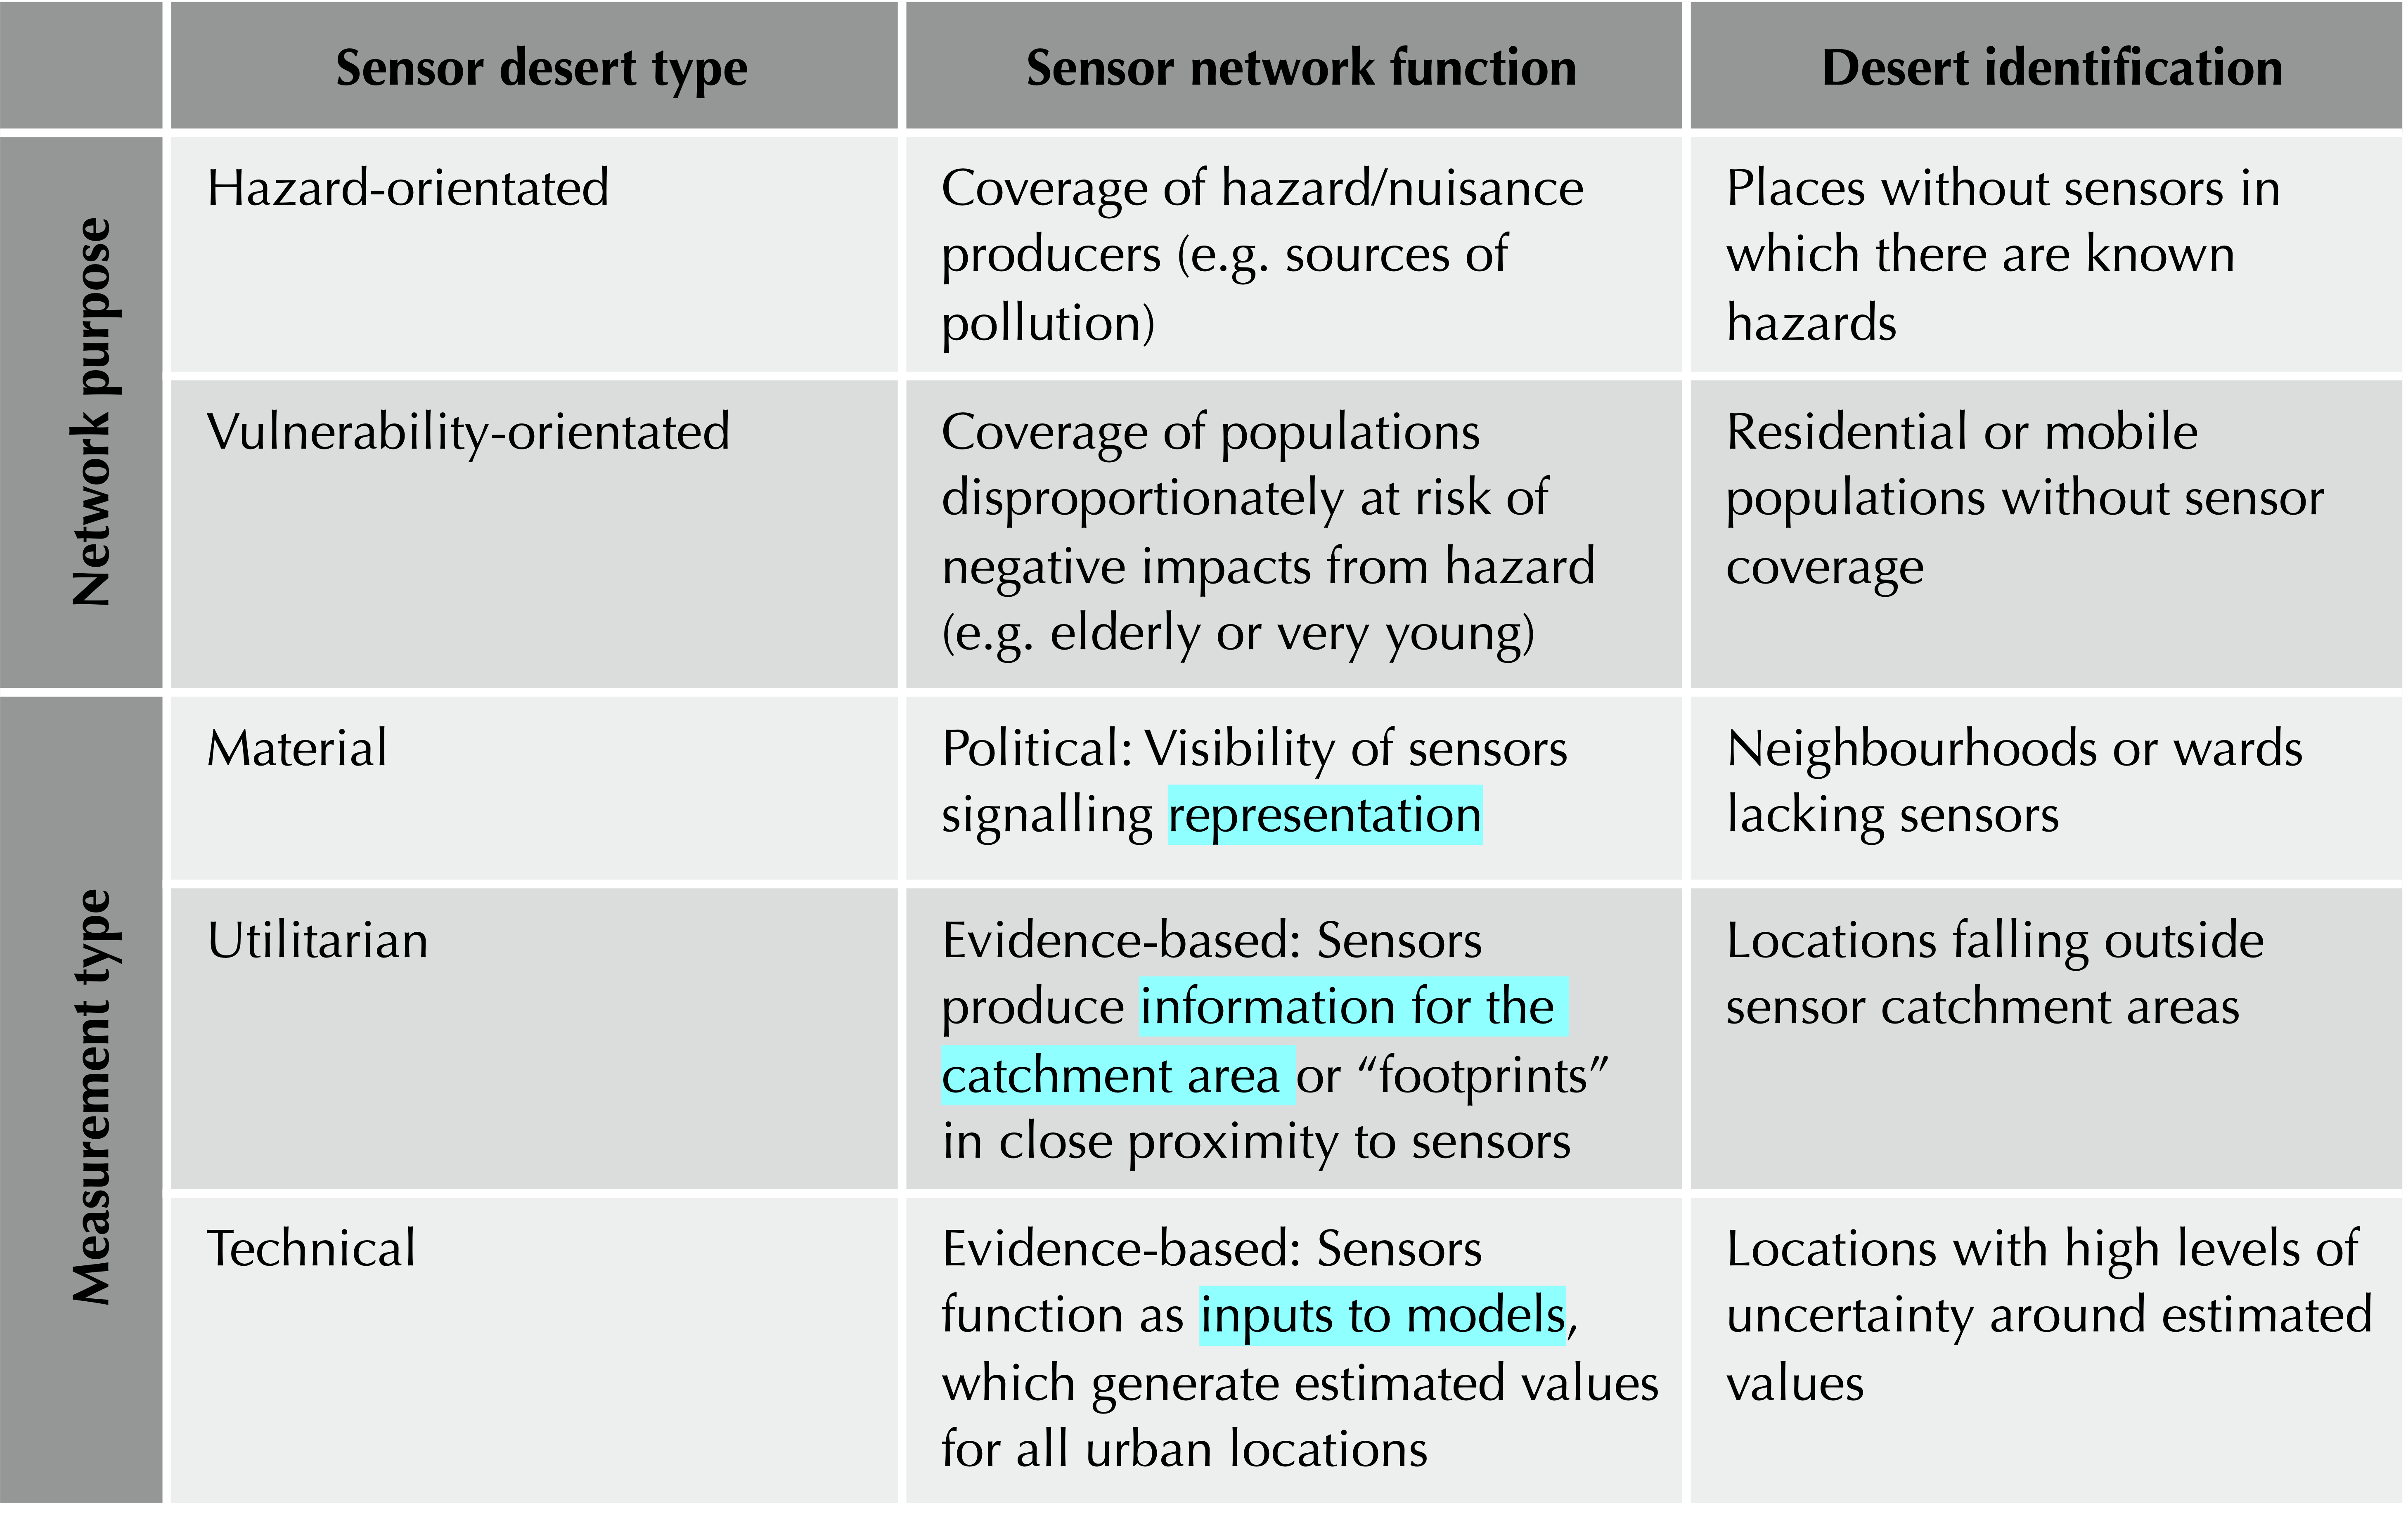
How to conceptualise and measure coverage?
How to support equitable decision-making around sensor placement?

“New technologies have a tendency to polarise and divide at many levels” (Batty et al., 2012)
“smart cities are also internally differentiated … they are geographically uneven at a variety of scales. Whatever it means for a city to be ‘smart’, it is also readily apparent that not all spaces of the city will be equally smart, meaning that smart cities will privilege some places, people and activities over others.” (Shelton et al. 2015)
“Geographies of codified knowledge have always been characterized by stark core–periphery patterns, with some parts of the world at the centre of global voice and representation and many others invisible or unheard.” (Graham et al. 2014)
“urban futures anticipated by urban big data assemblages are highly uneven, data and algorithms cannot divest themselves of urban inequalities and the persistence of their geographies” (Leszczynski, 2016)
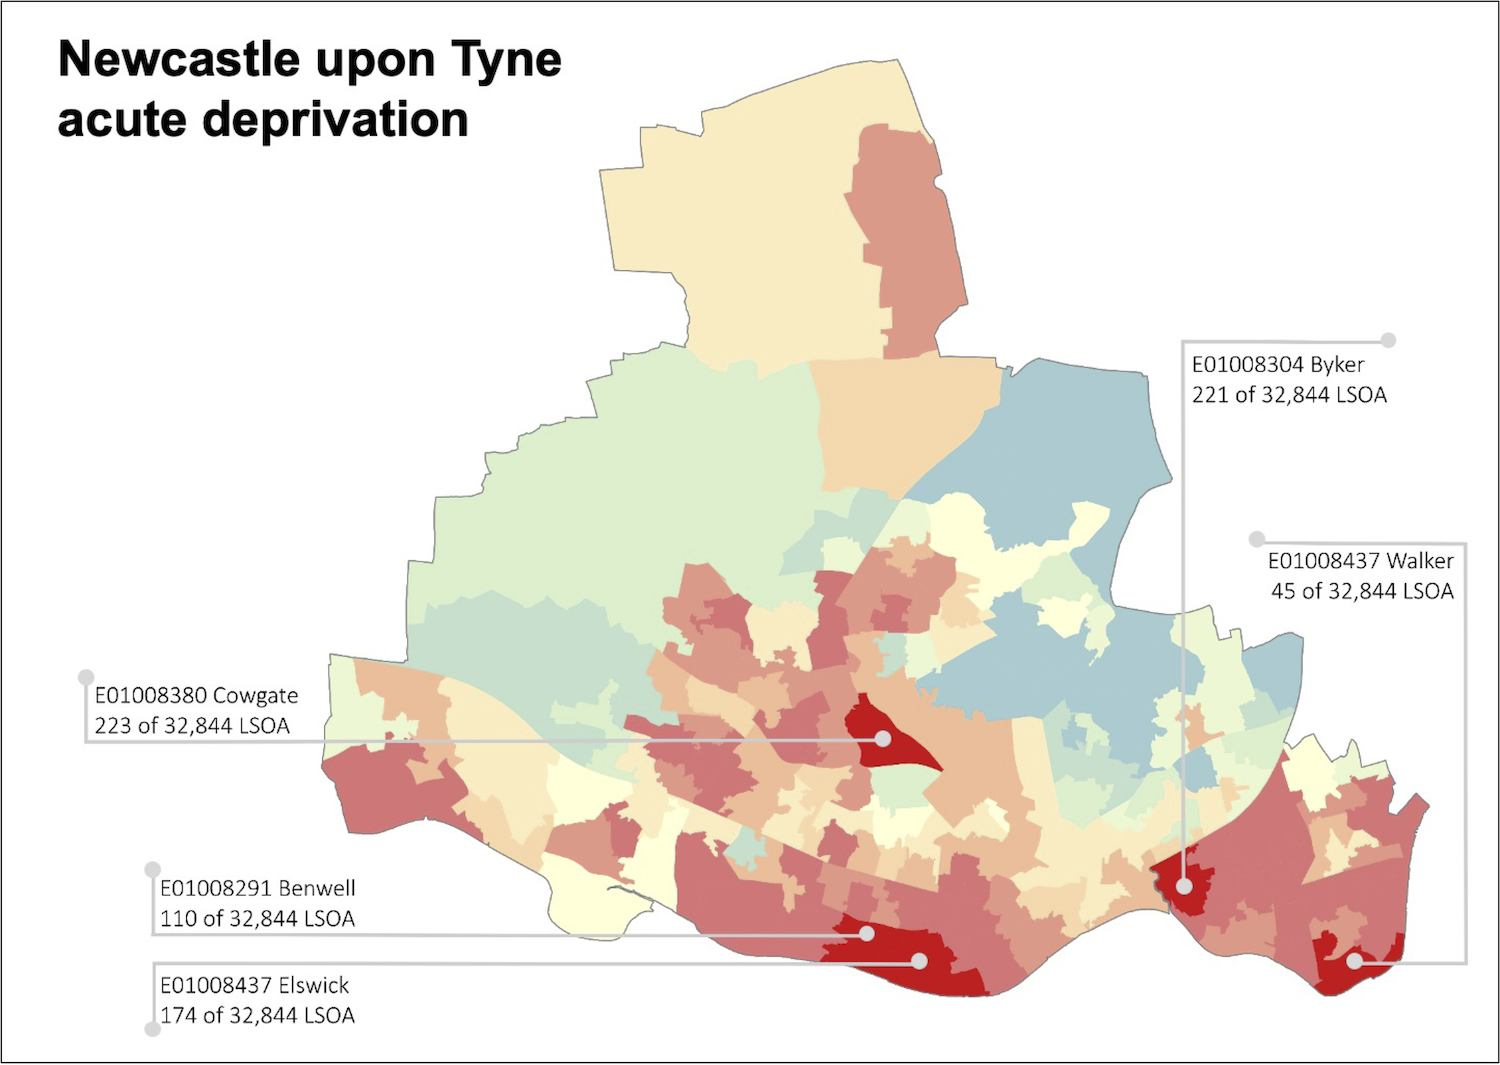
Areas of the city:
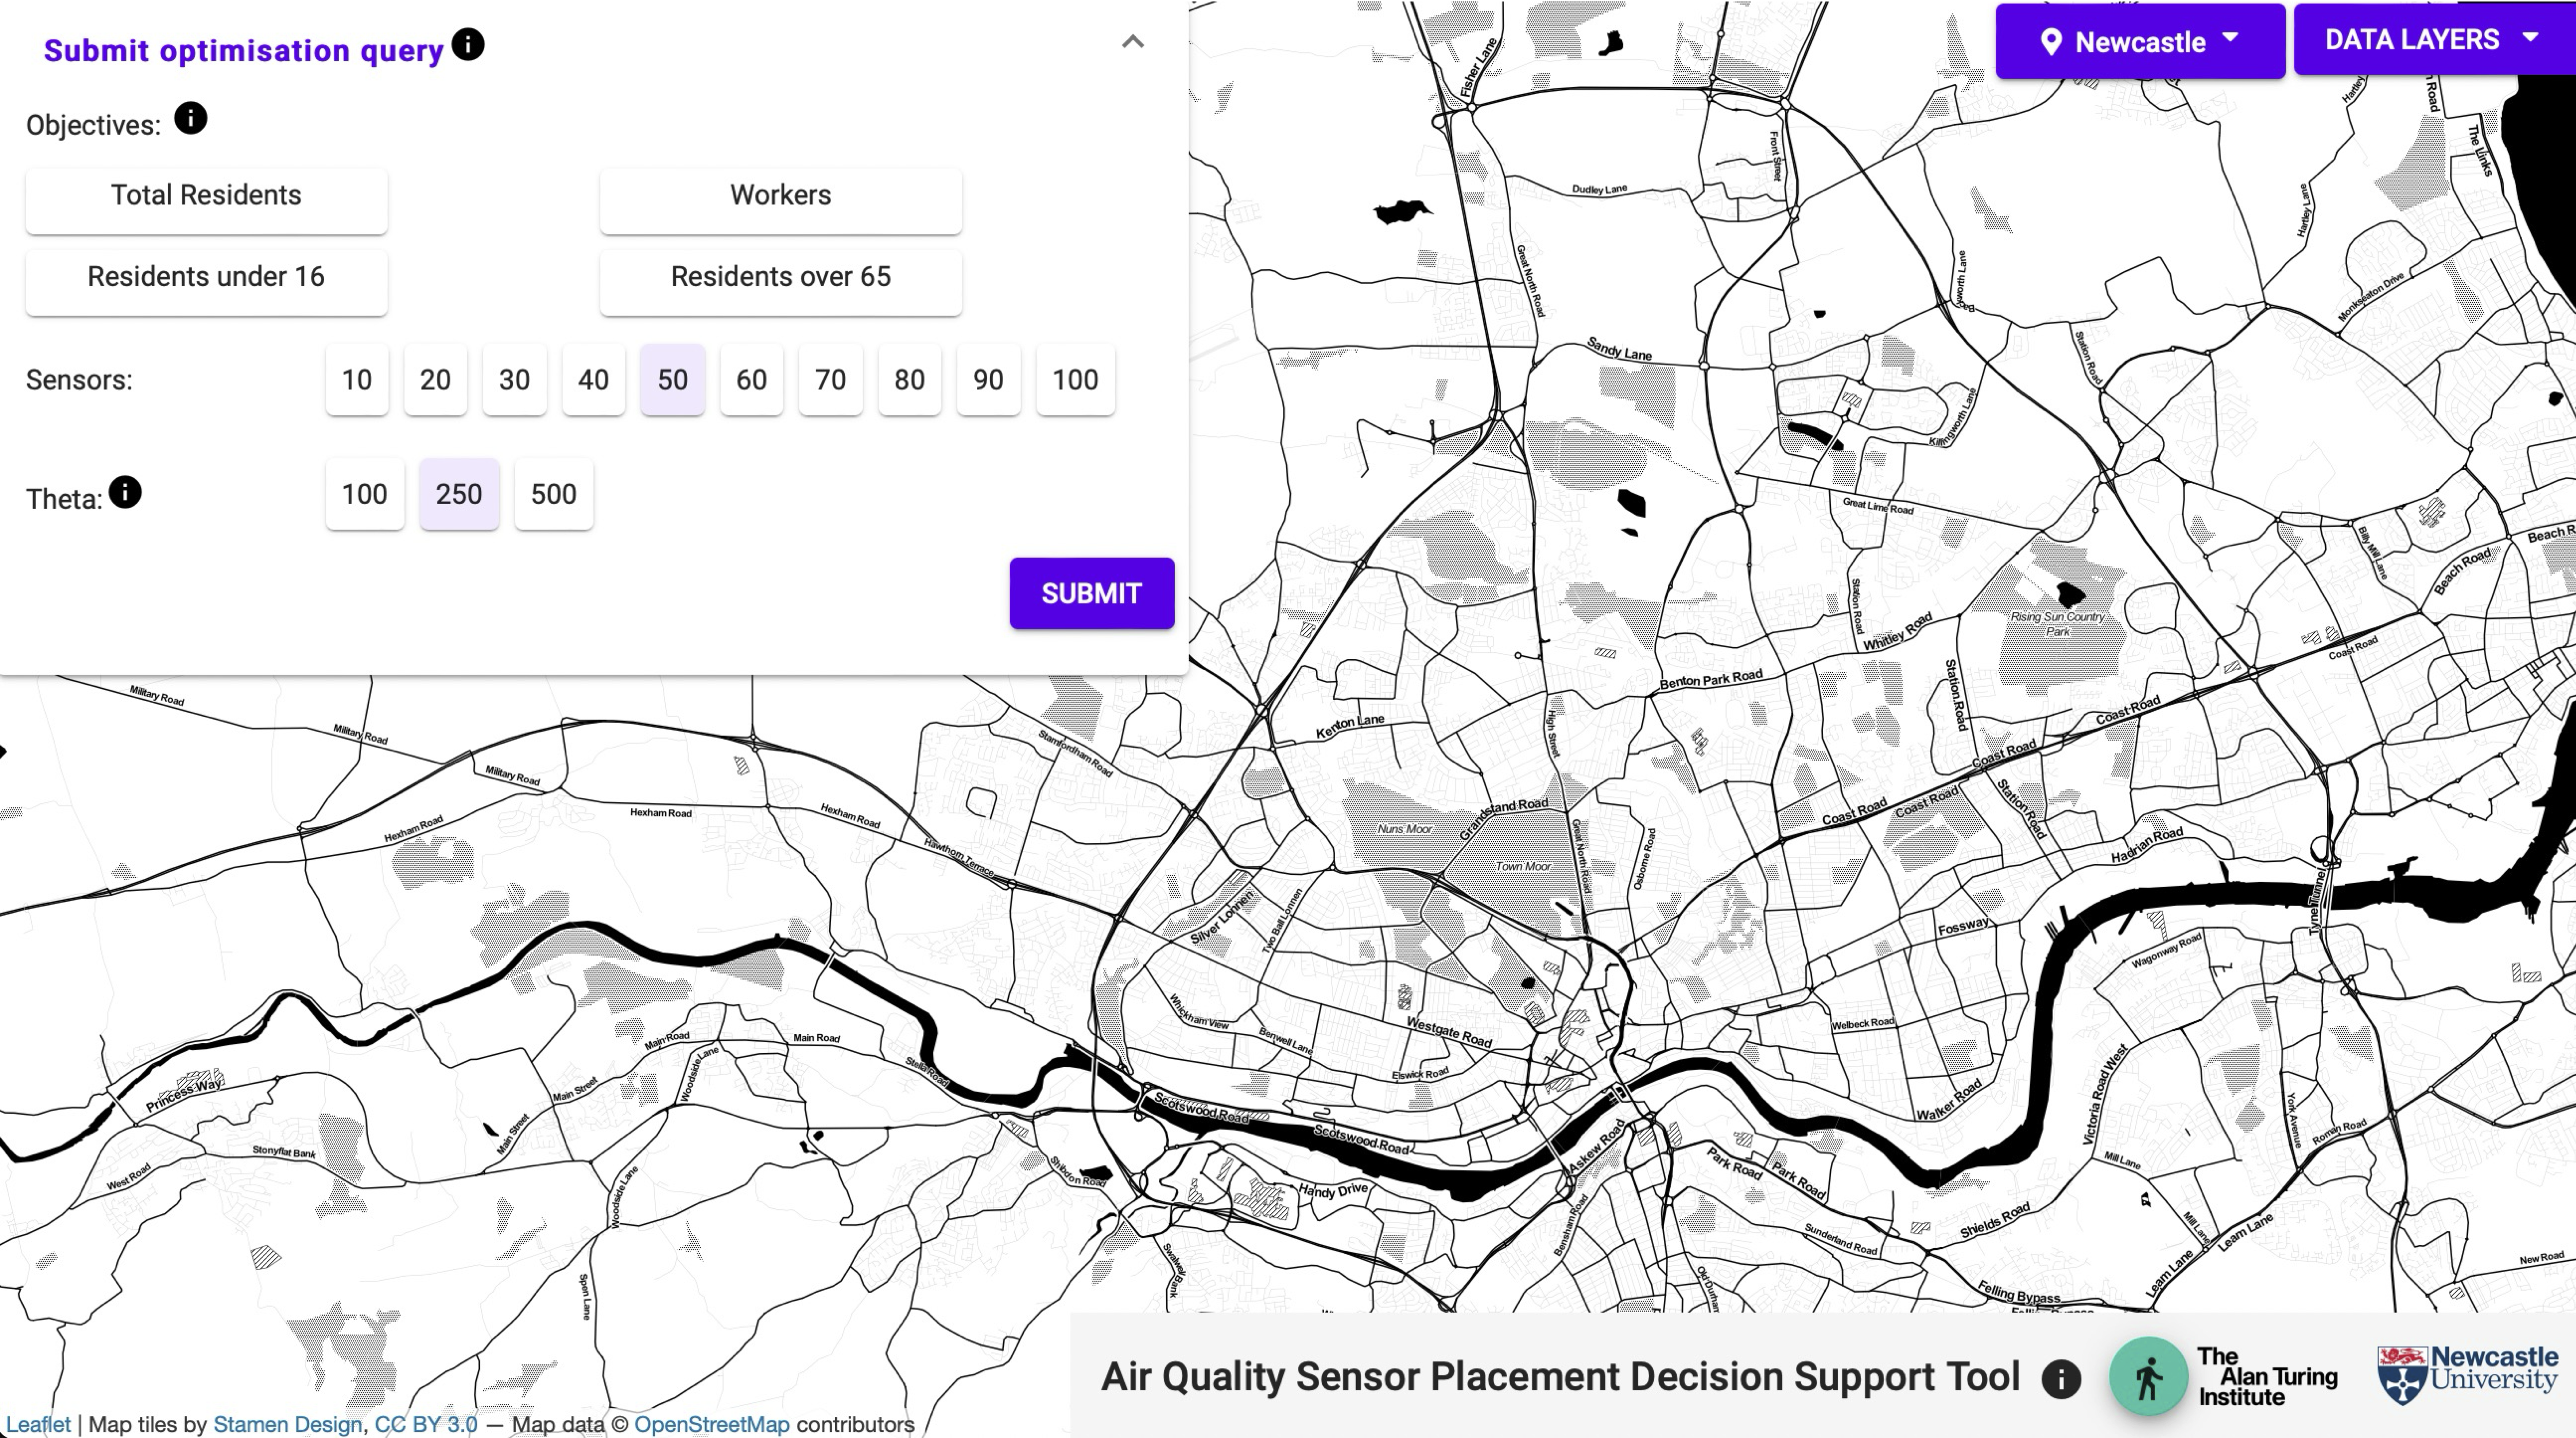
Two optimization approaches:
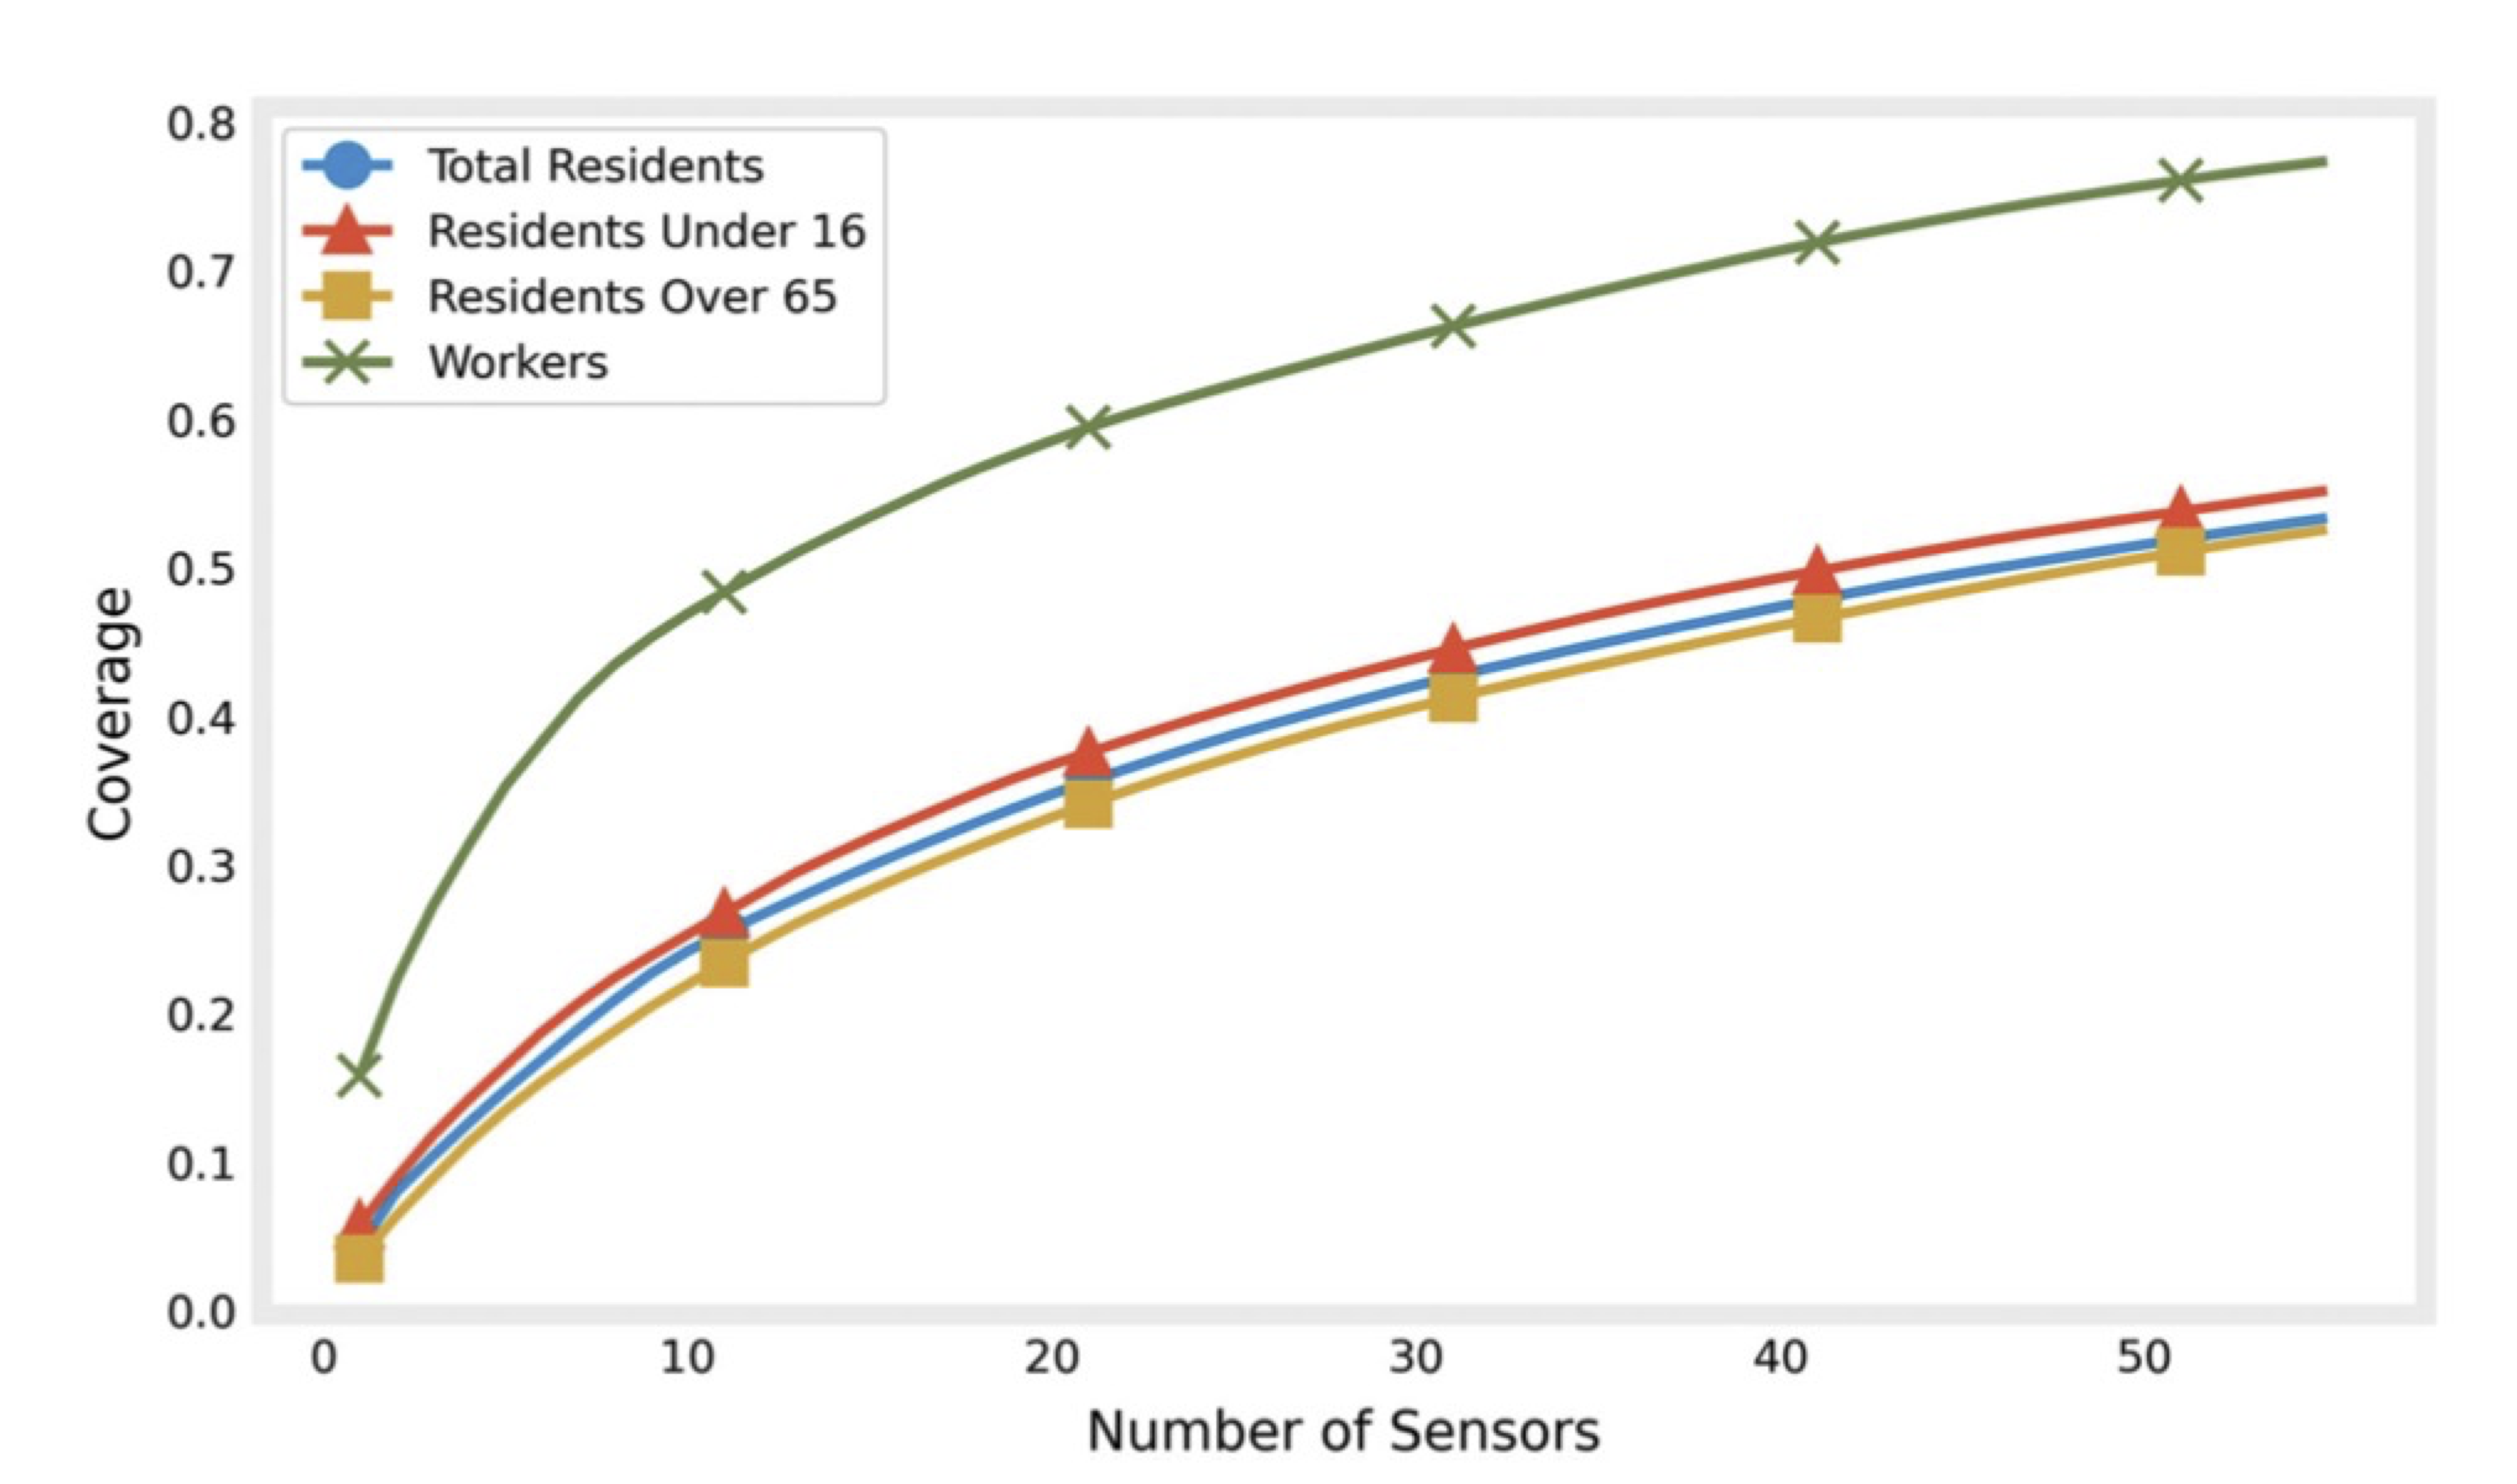
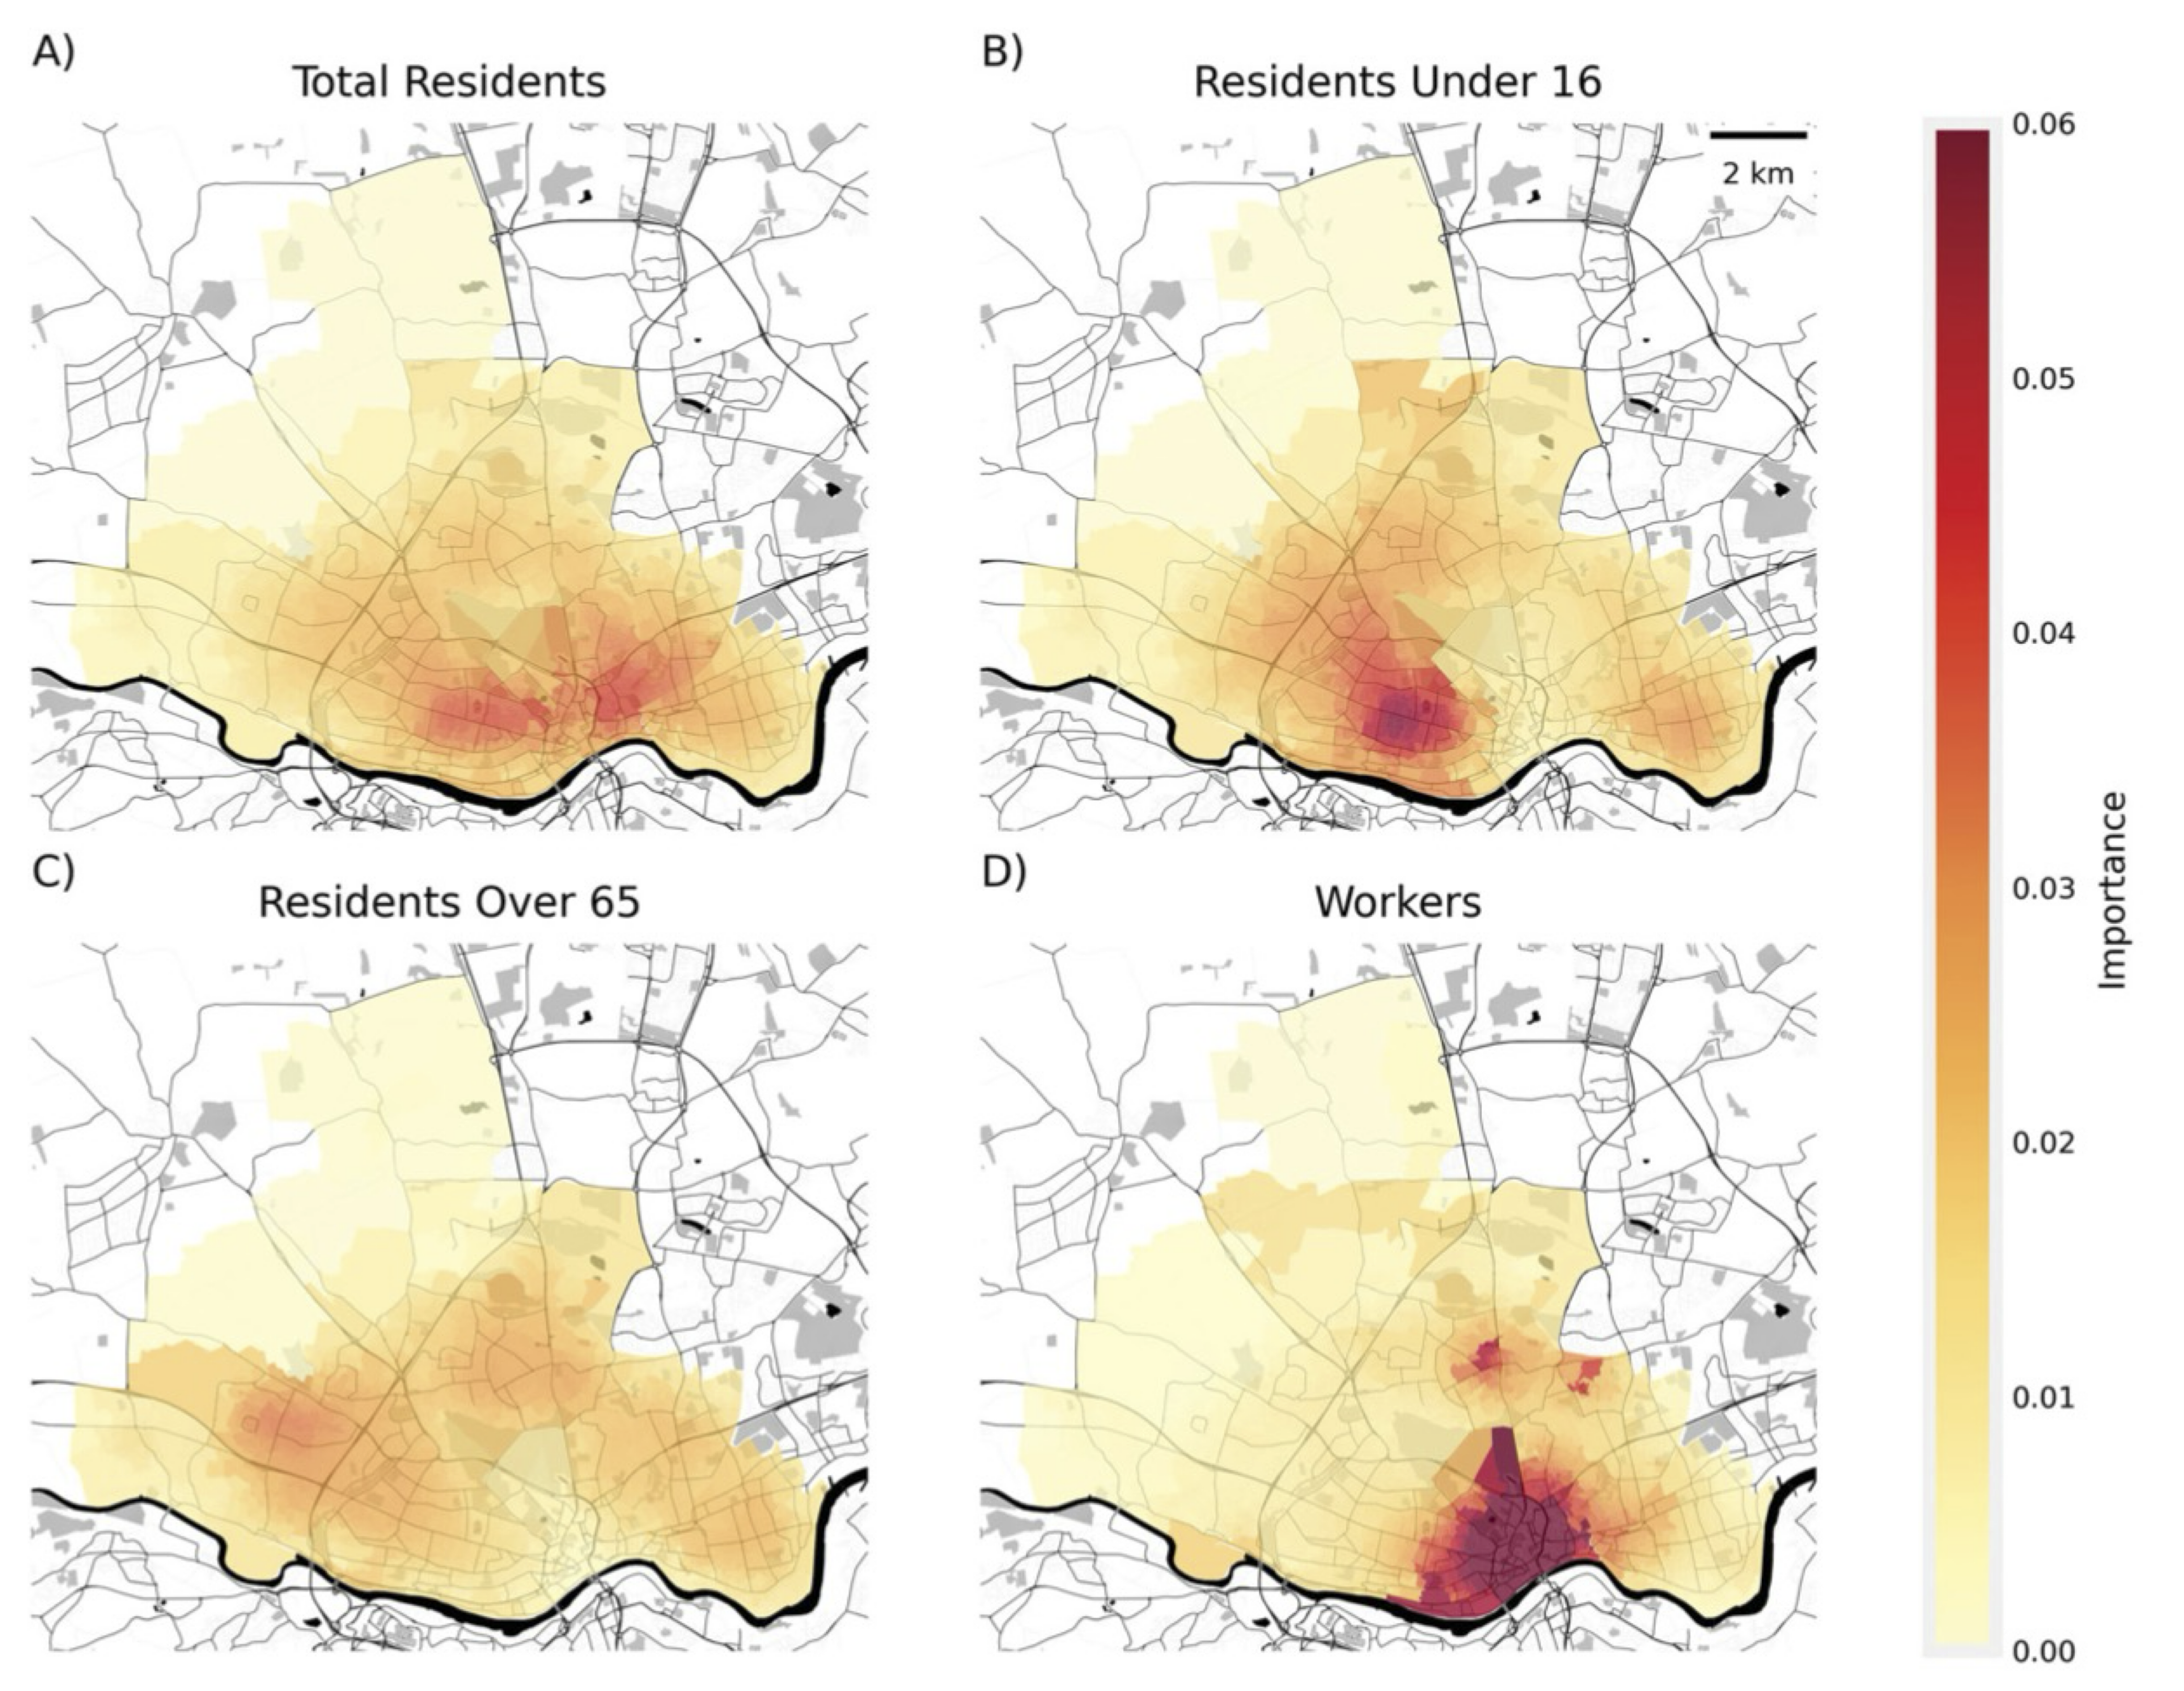
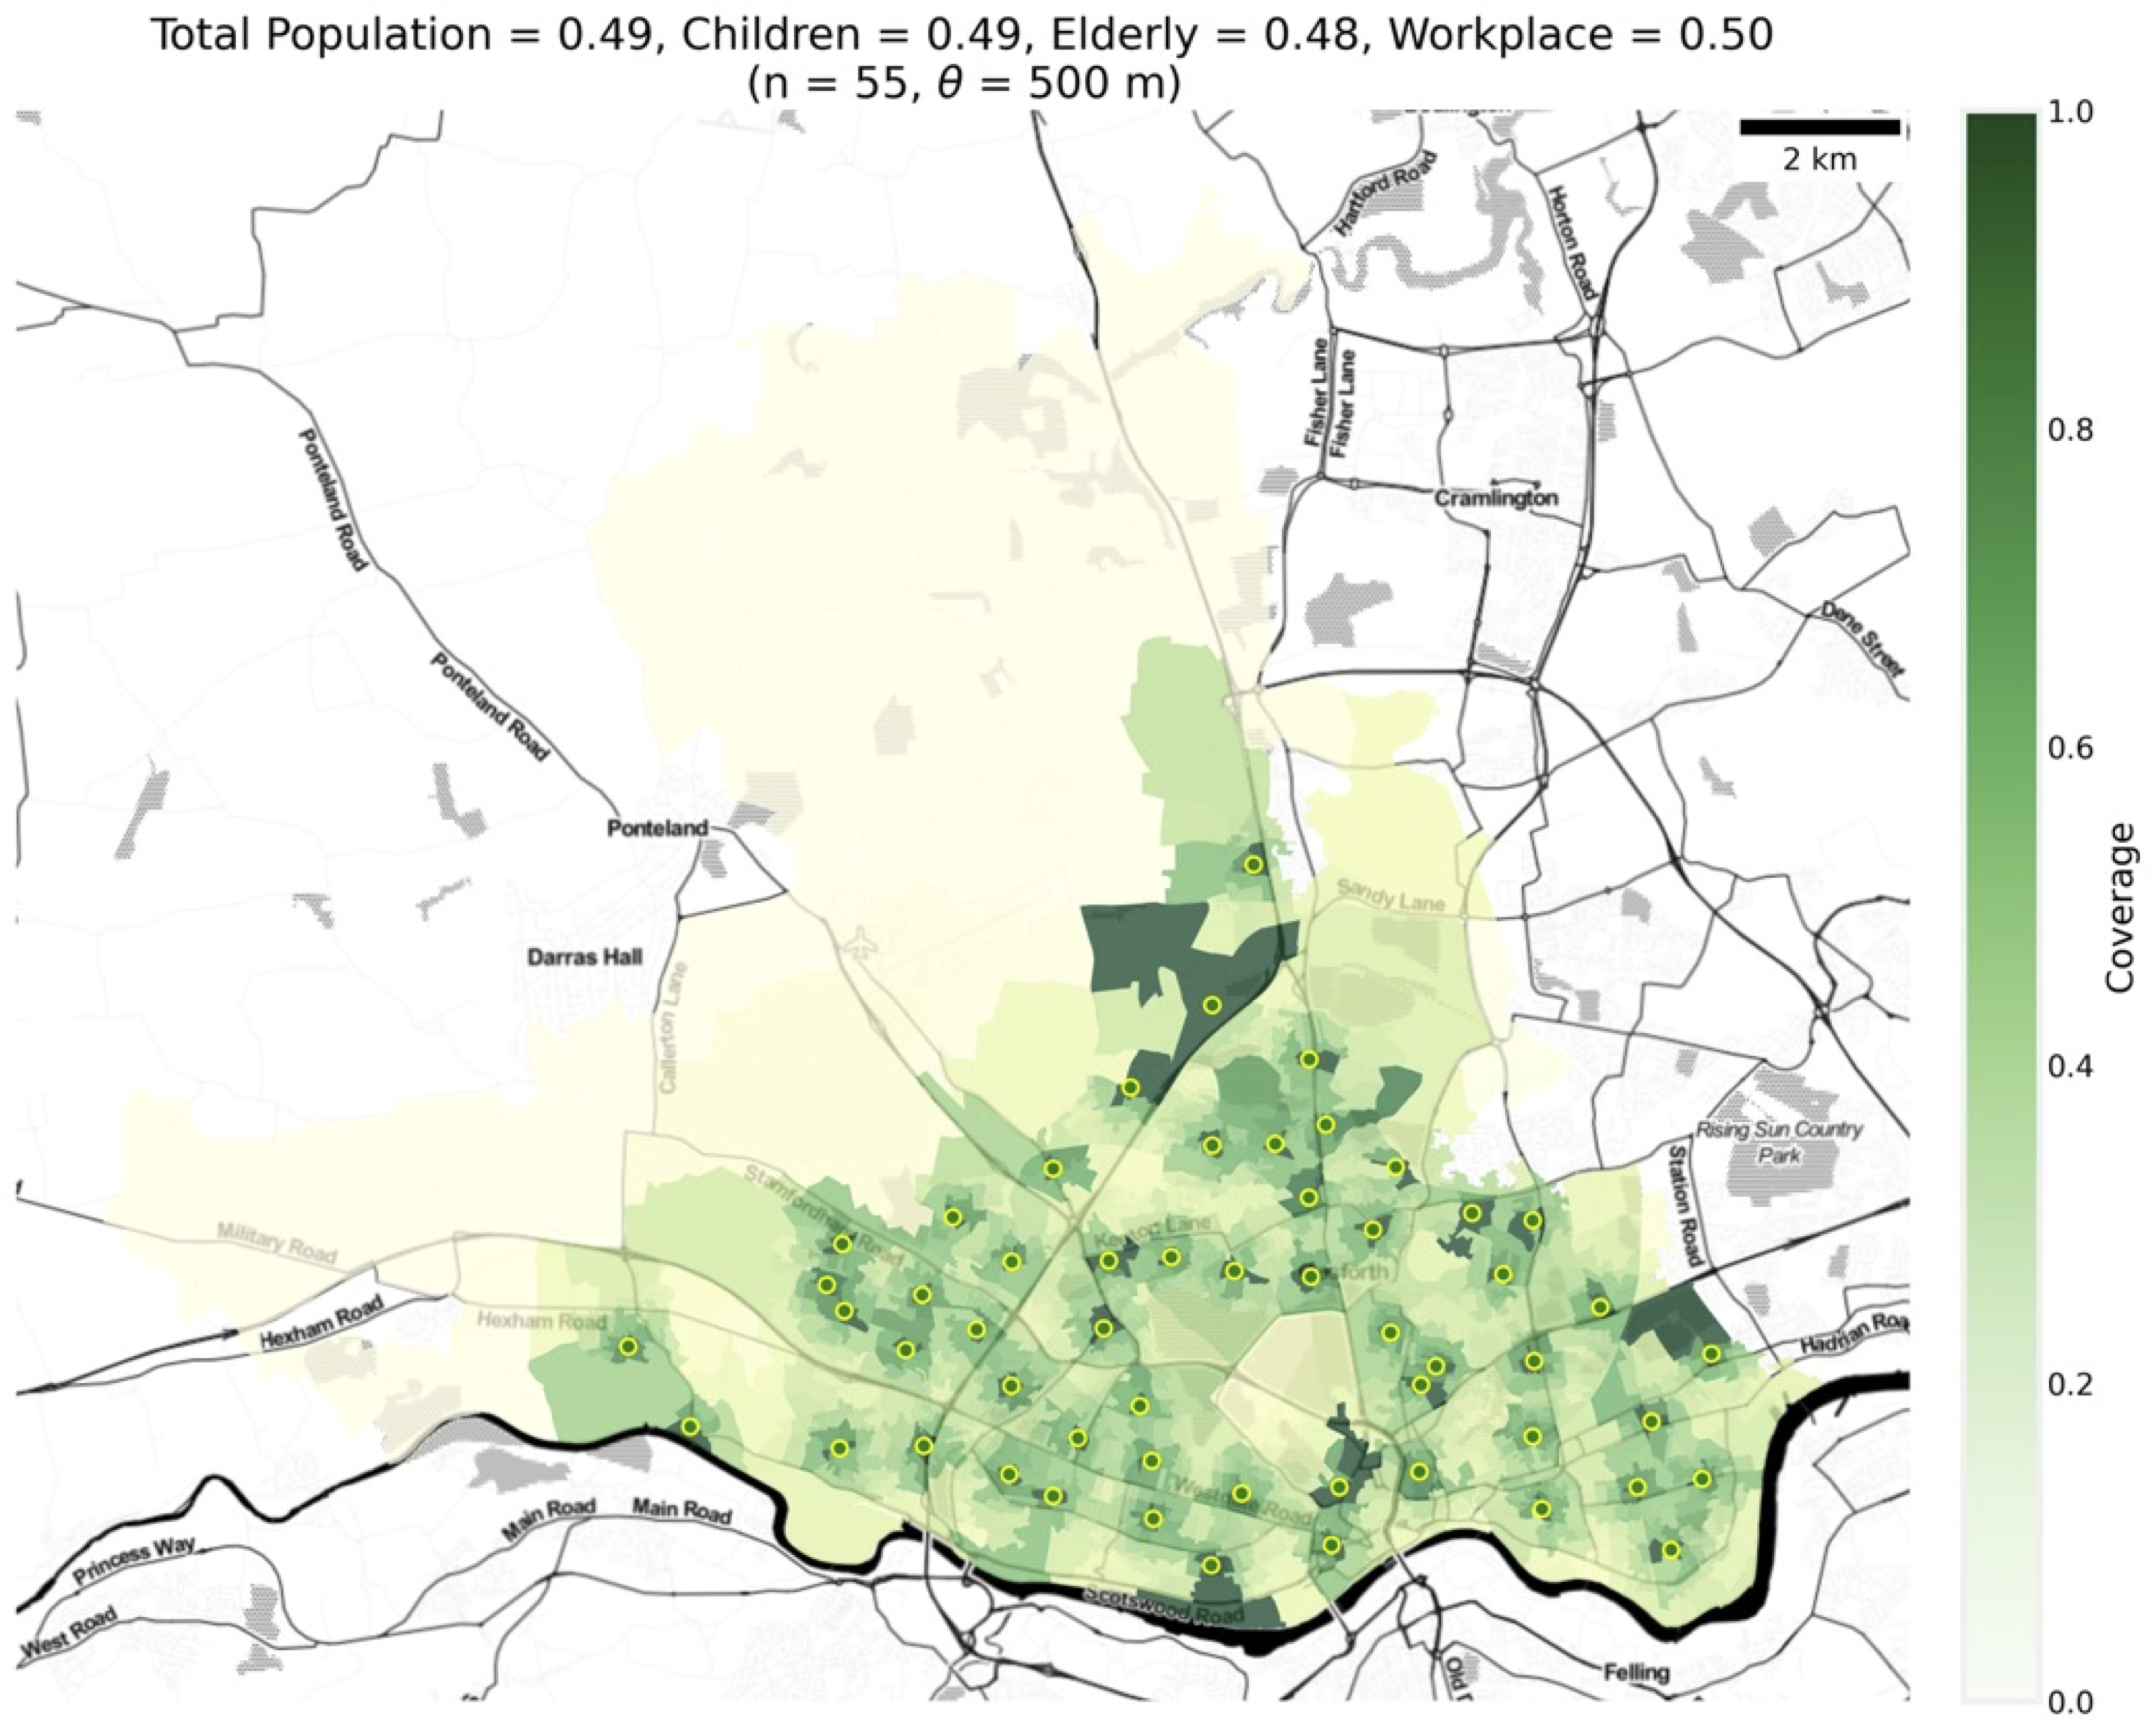
Single objective greedy algorithm: Place sensors one by one and maximize coverage of one sub-group only.
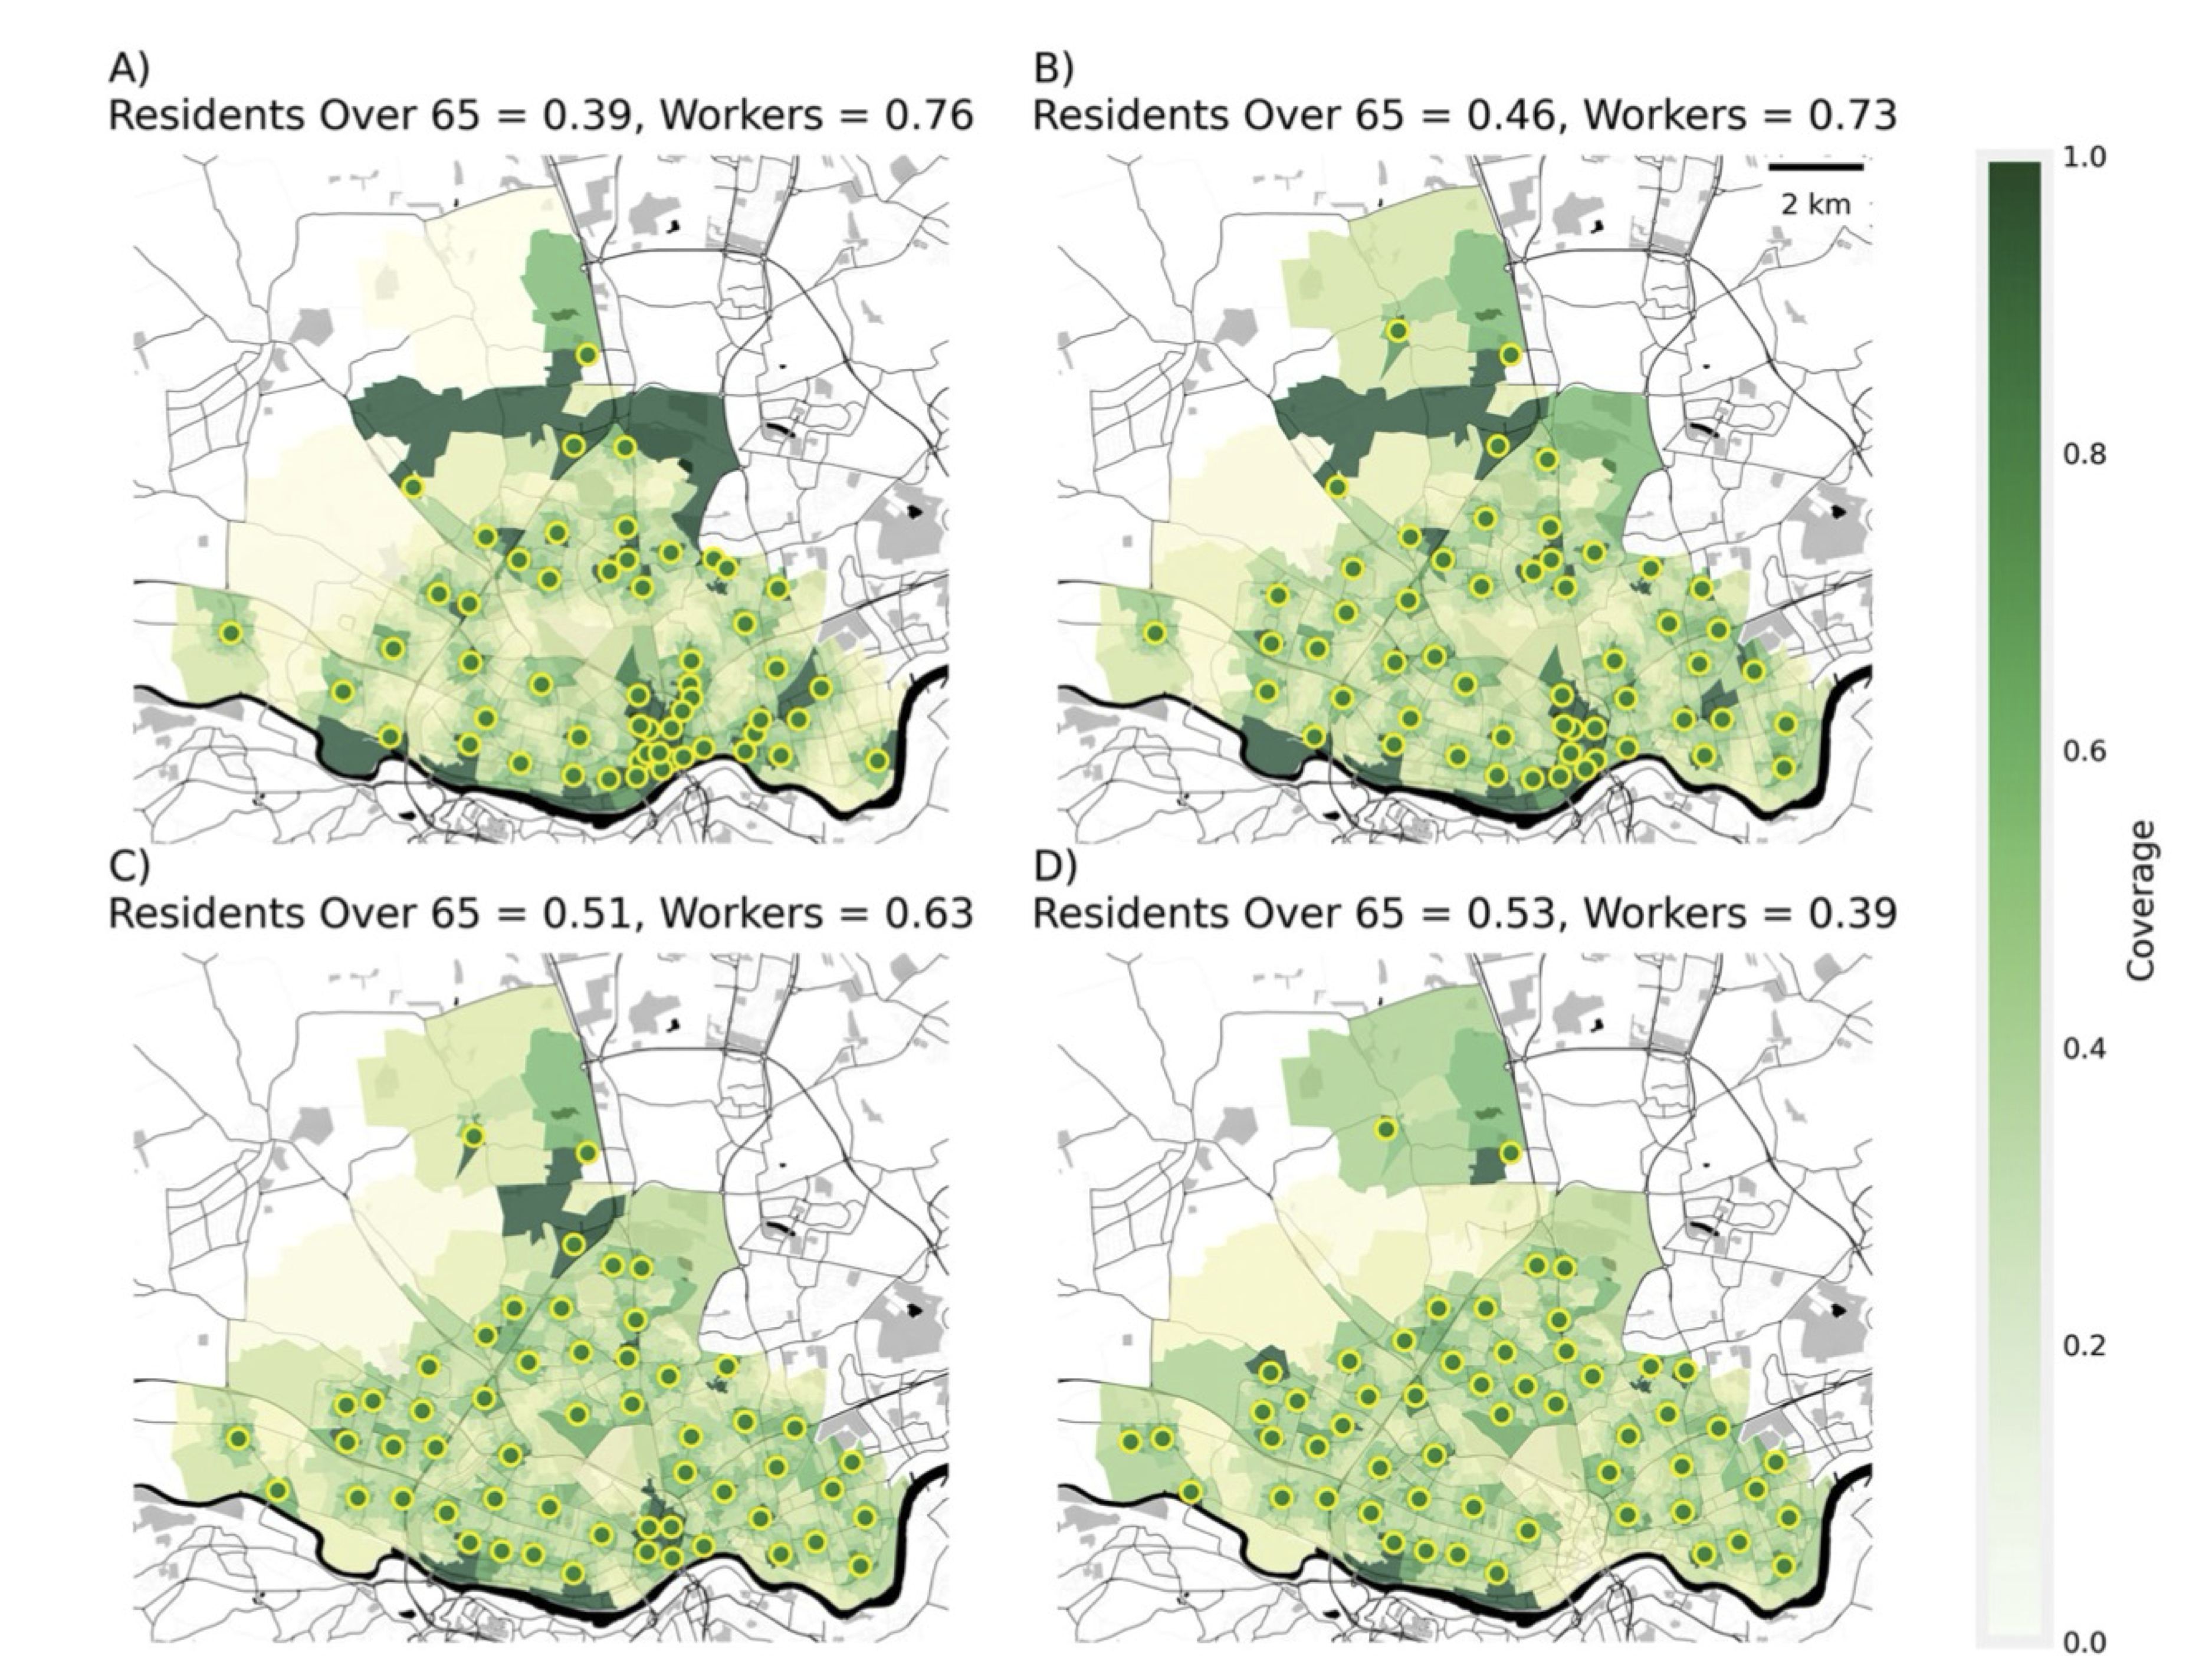
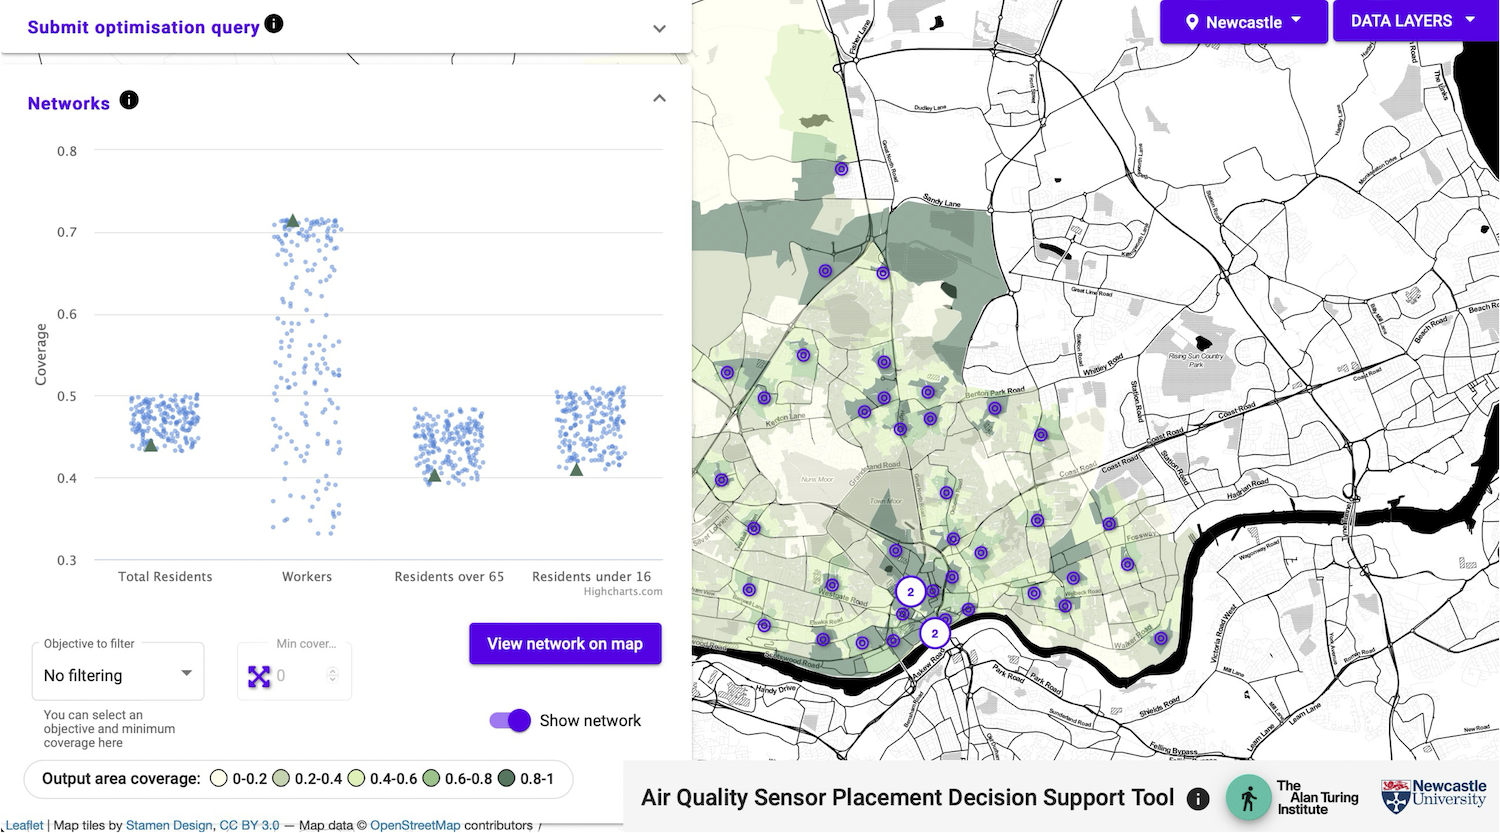
Multi-objective genetic algorithm (NSGA2): Generate a spectrum of networks representing the coverage trade-offs between different sub-groups.
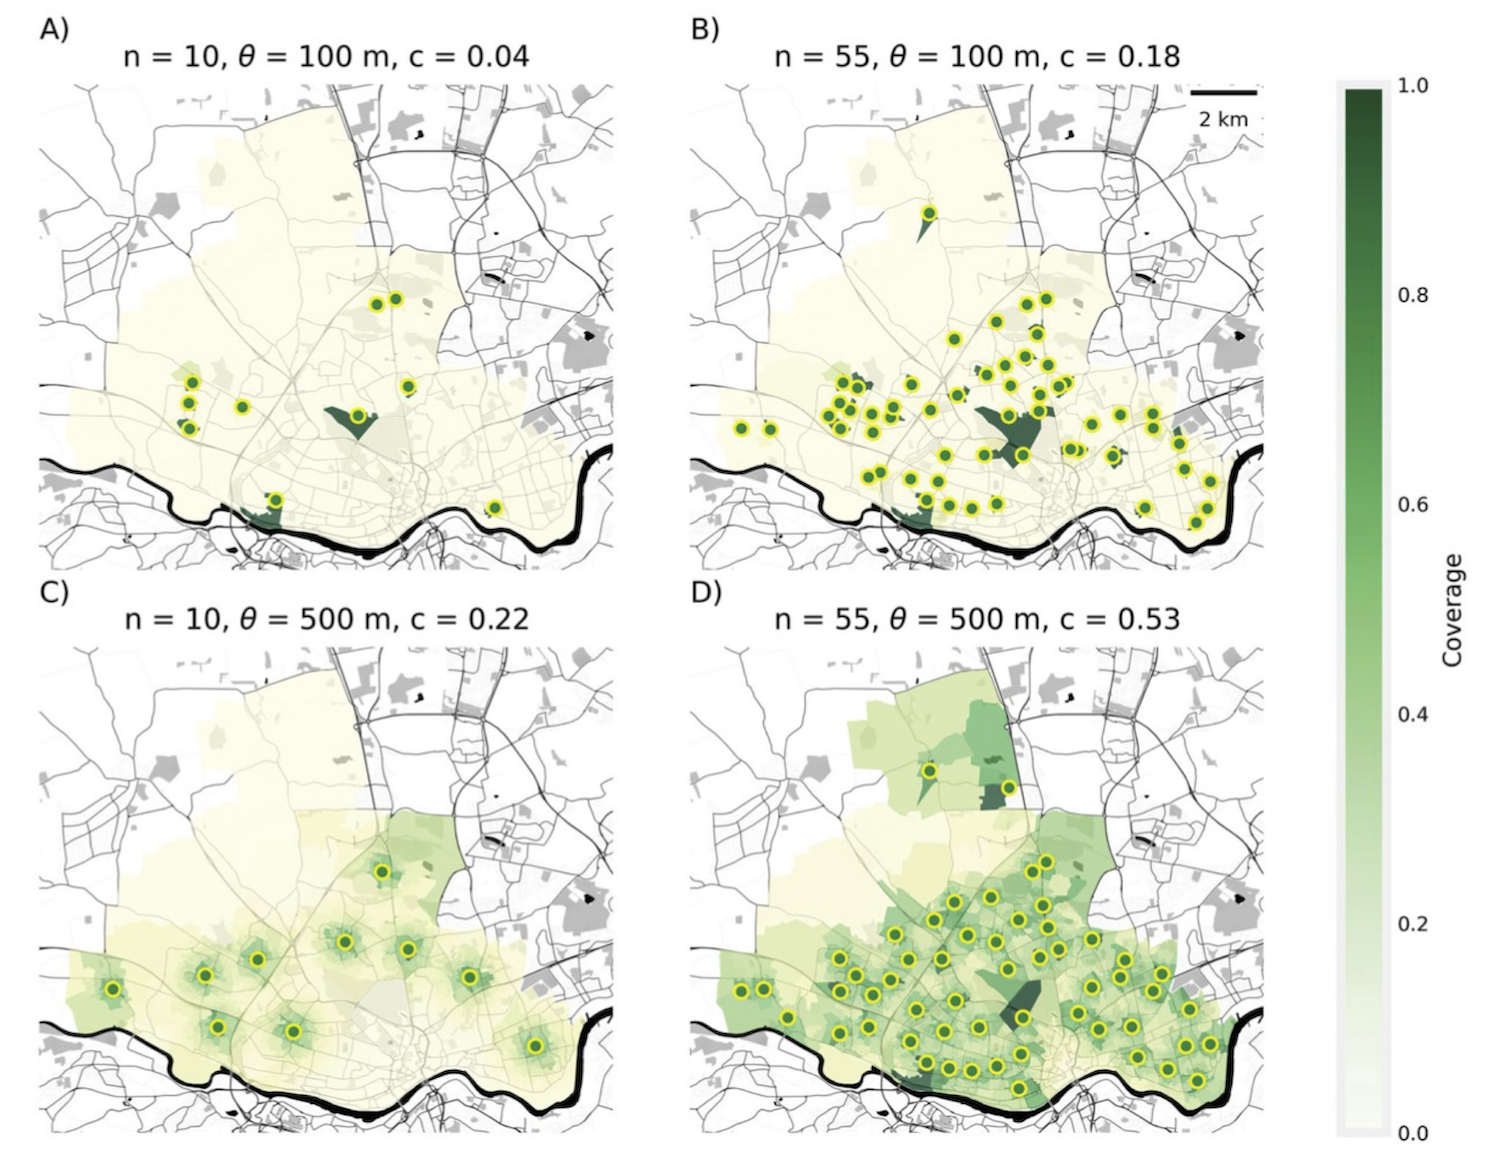
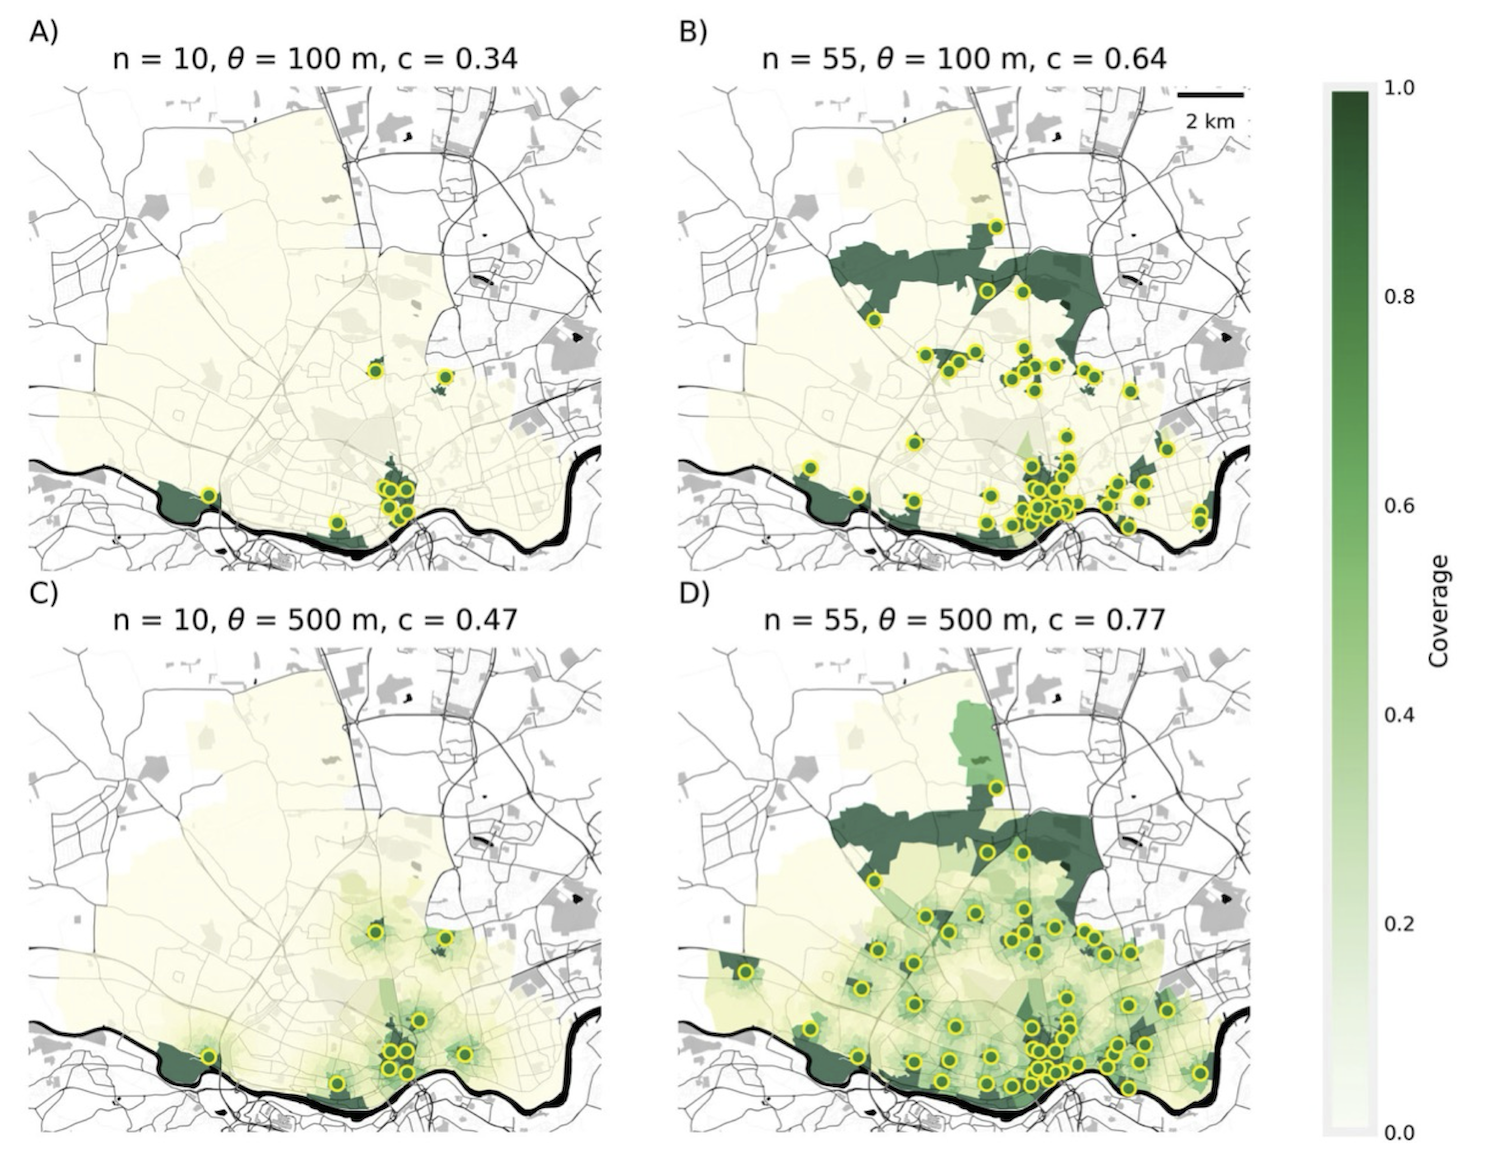
Define the “coverage” of output area 𝑖 due to sensor configuration 𝑗
Place sensors to maximize the weighted sum of output area coverages across the city
Sensors located at output area centroids
Coverage for older residents (>65)
Coverage for place-of-work population


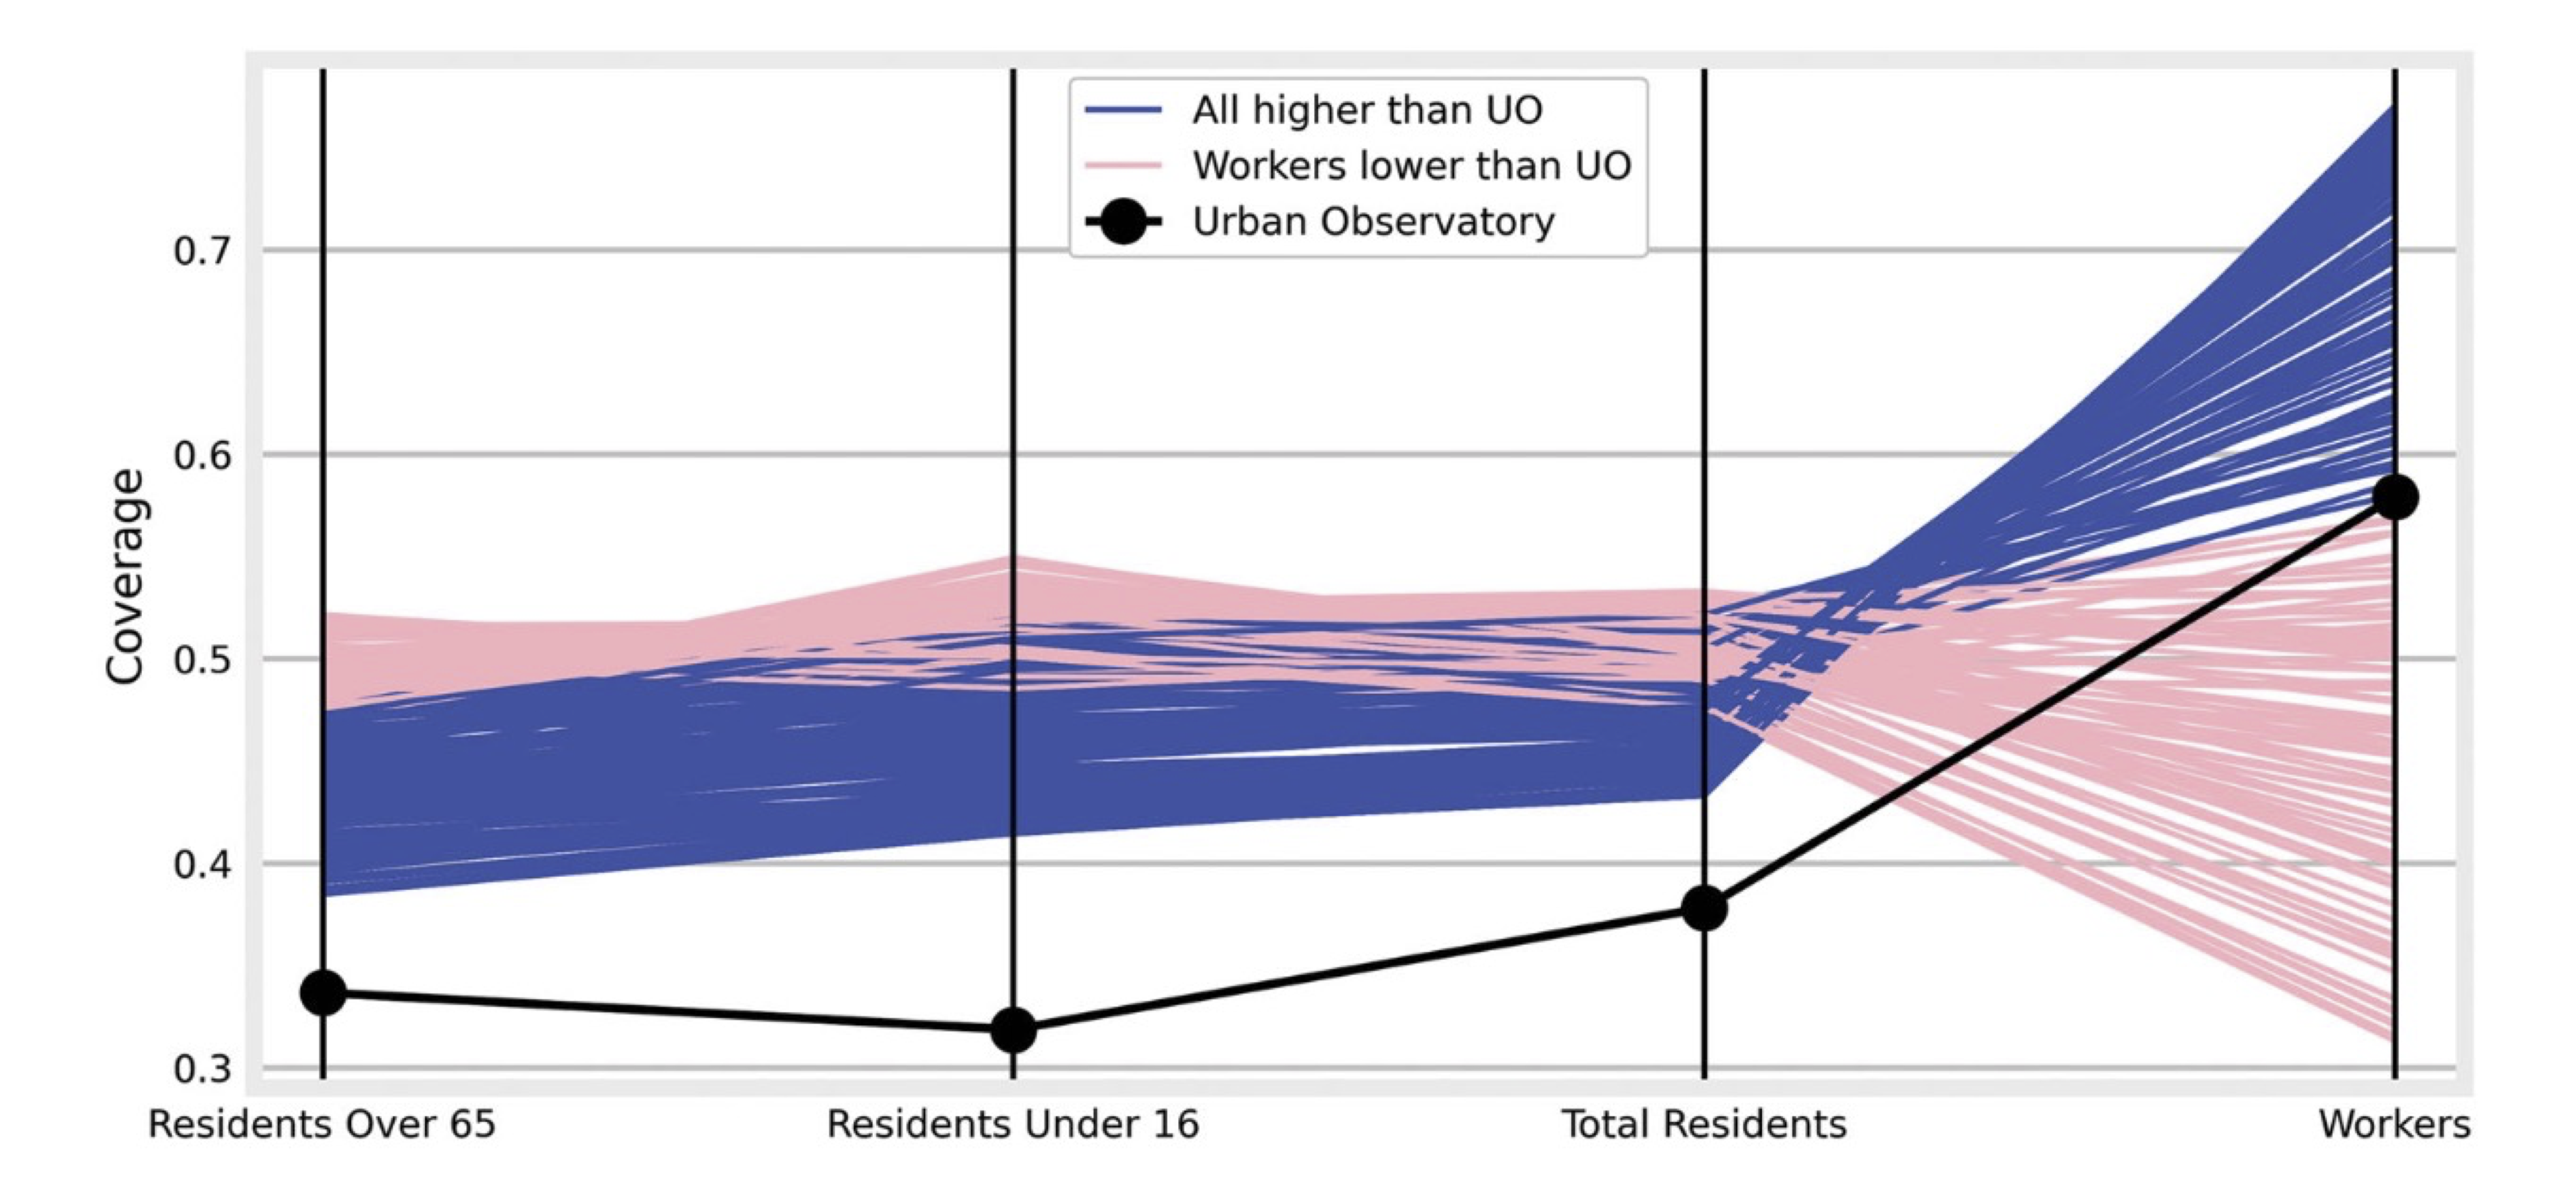
Multi-Objective Optimization
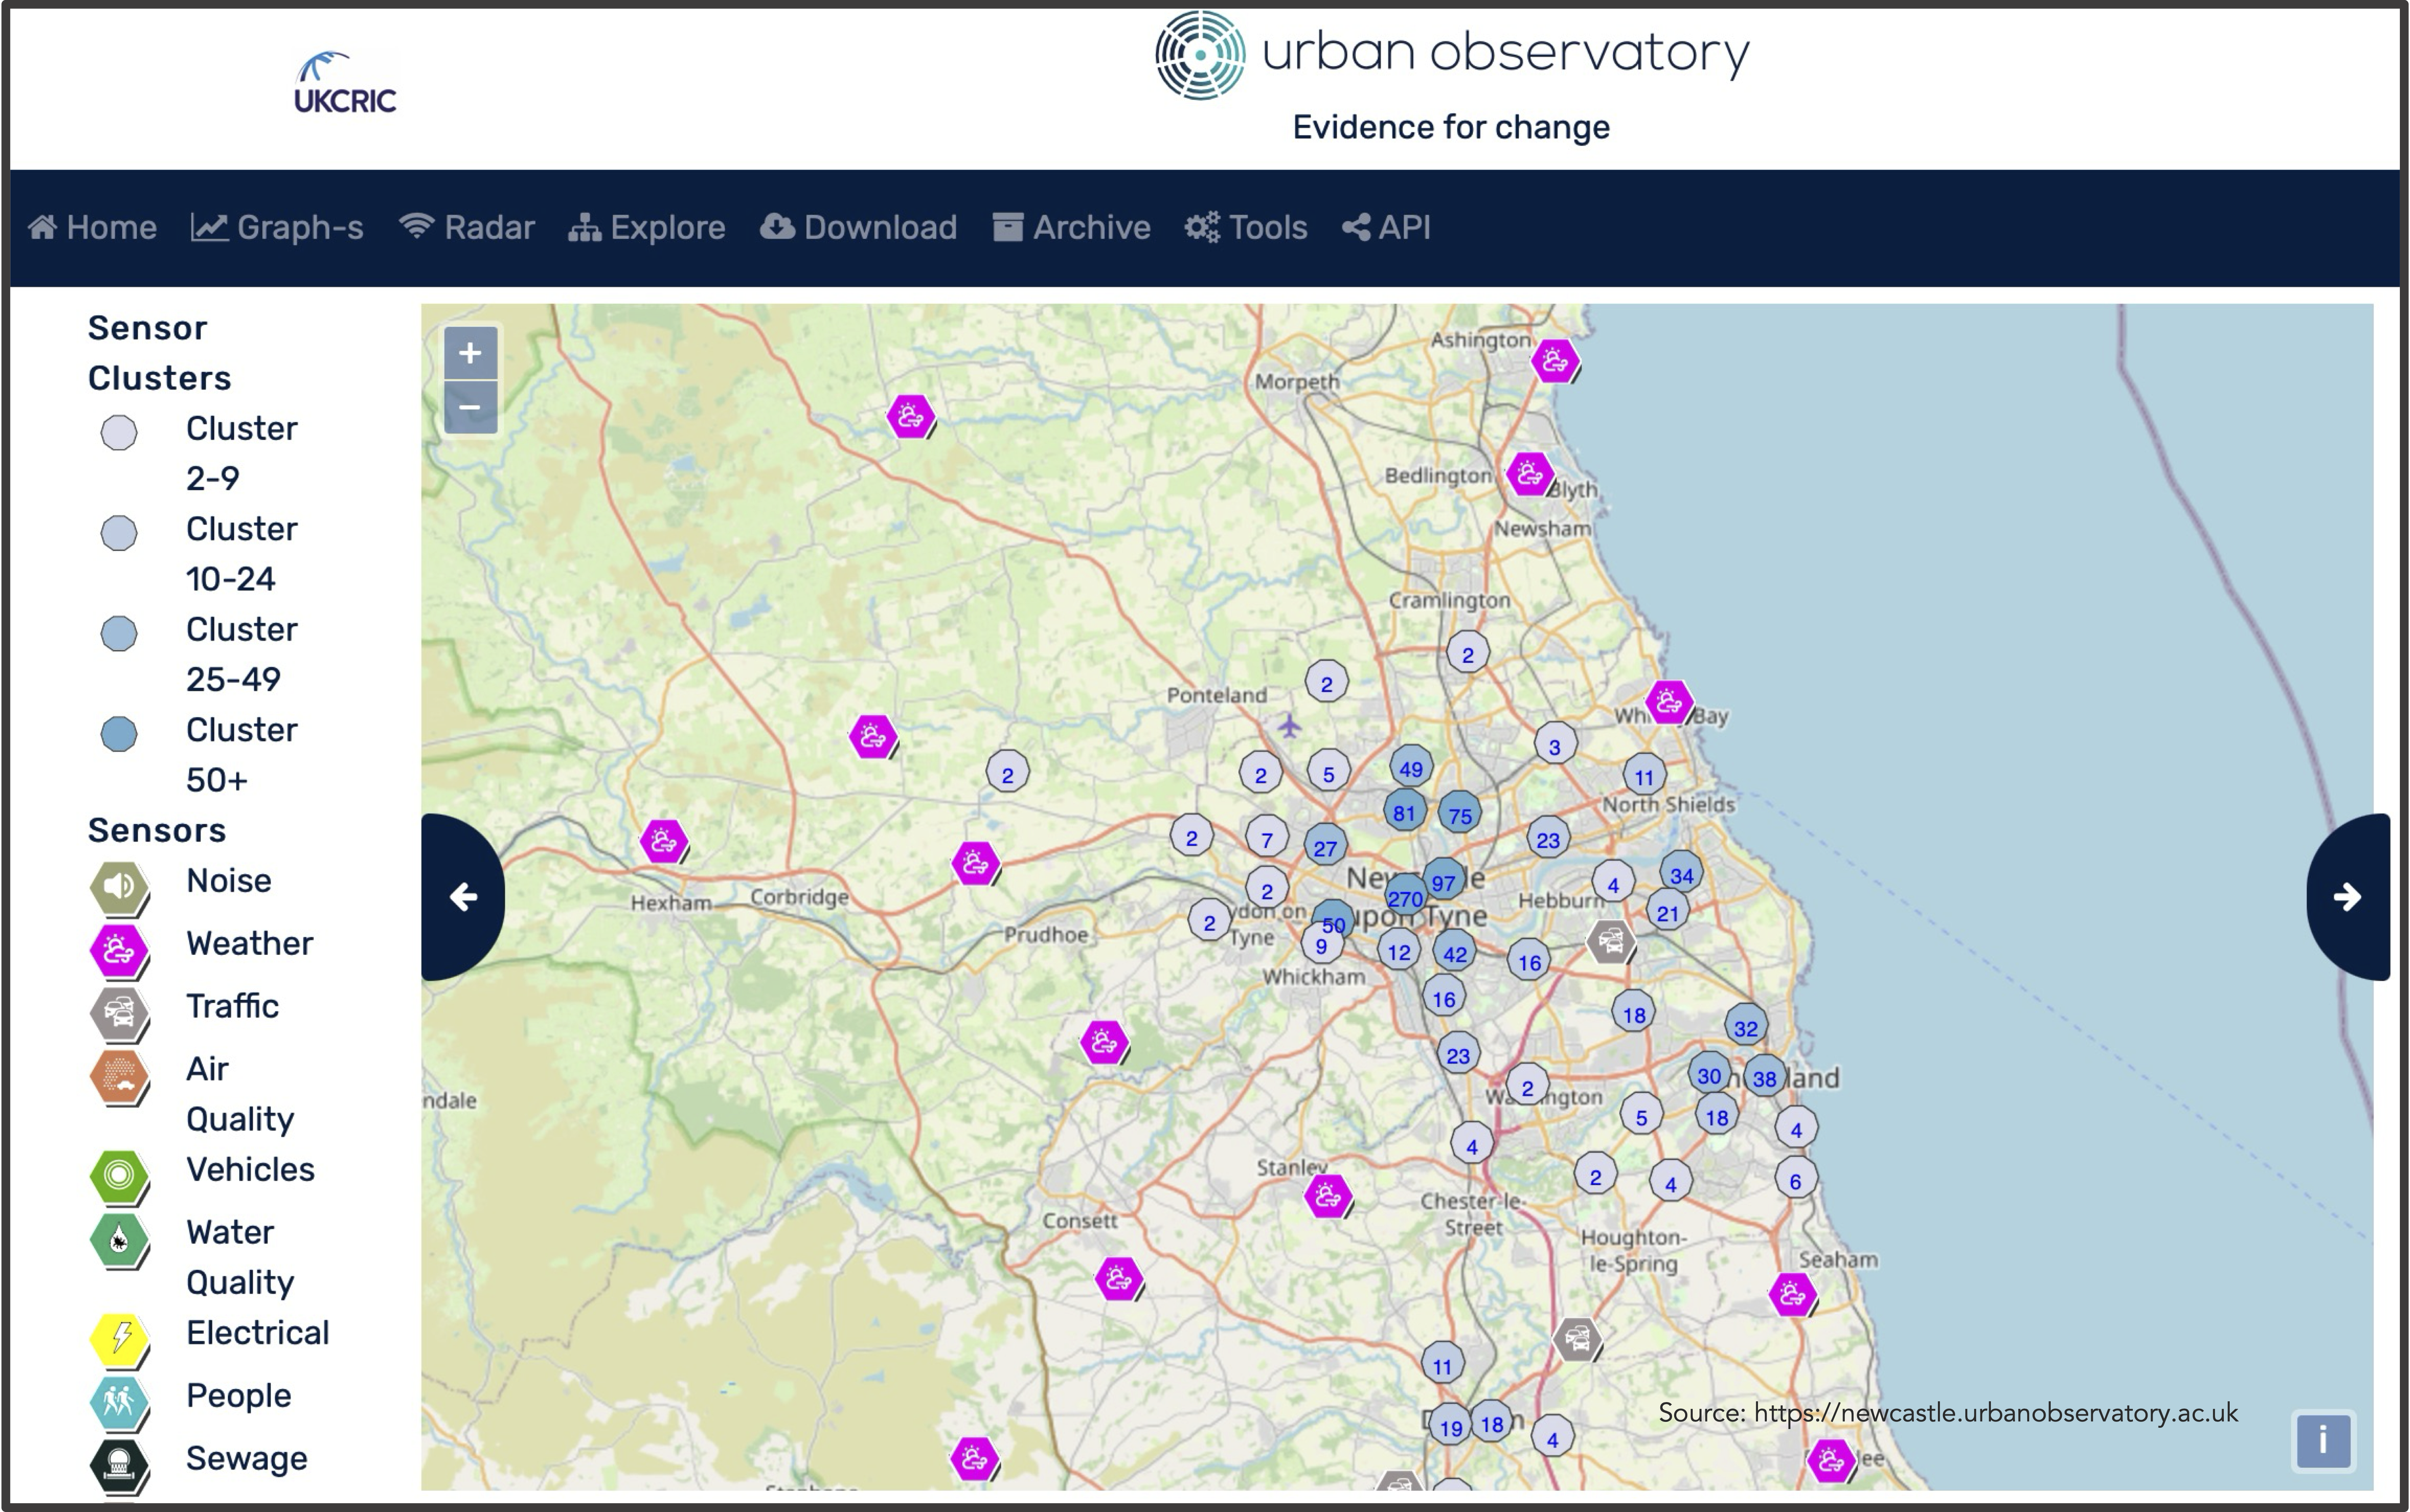
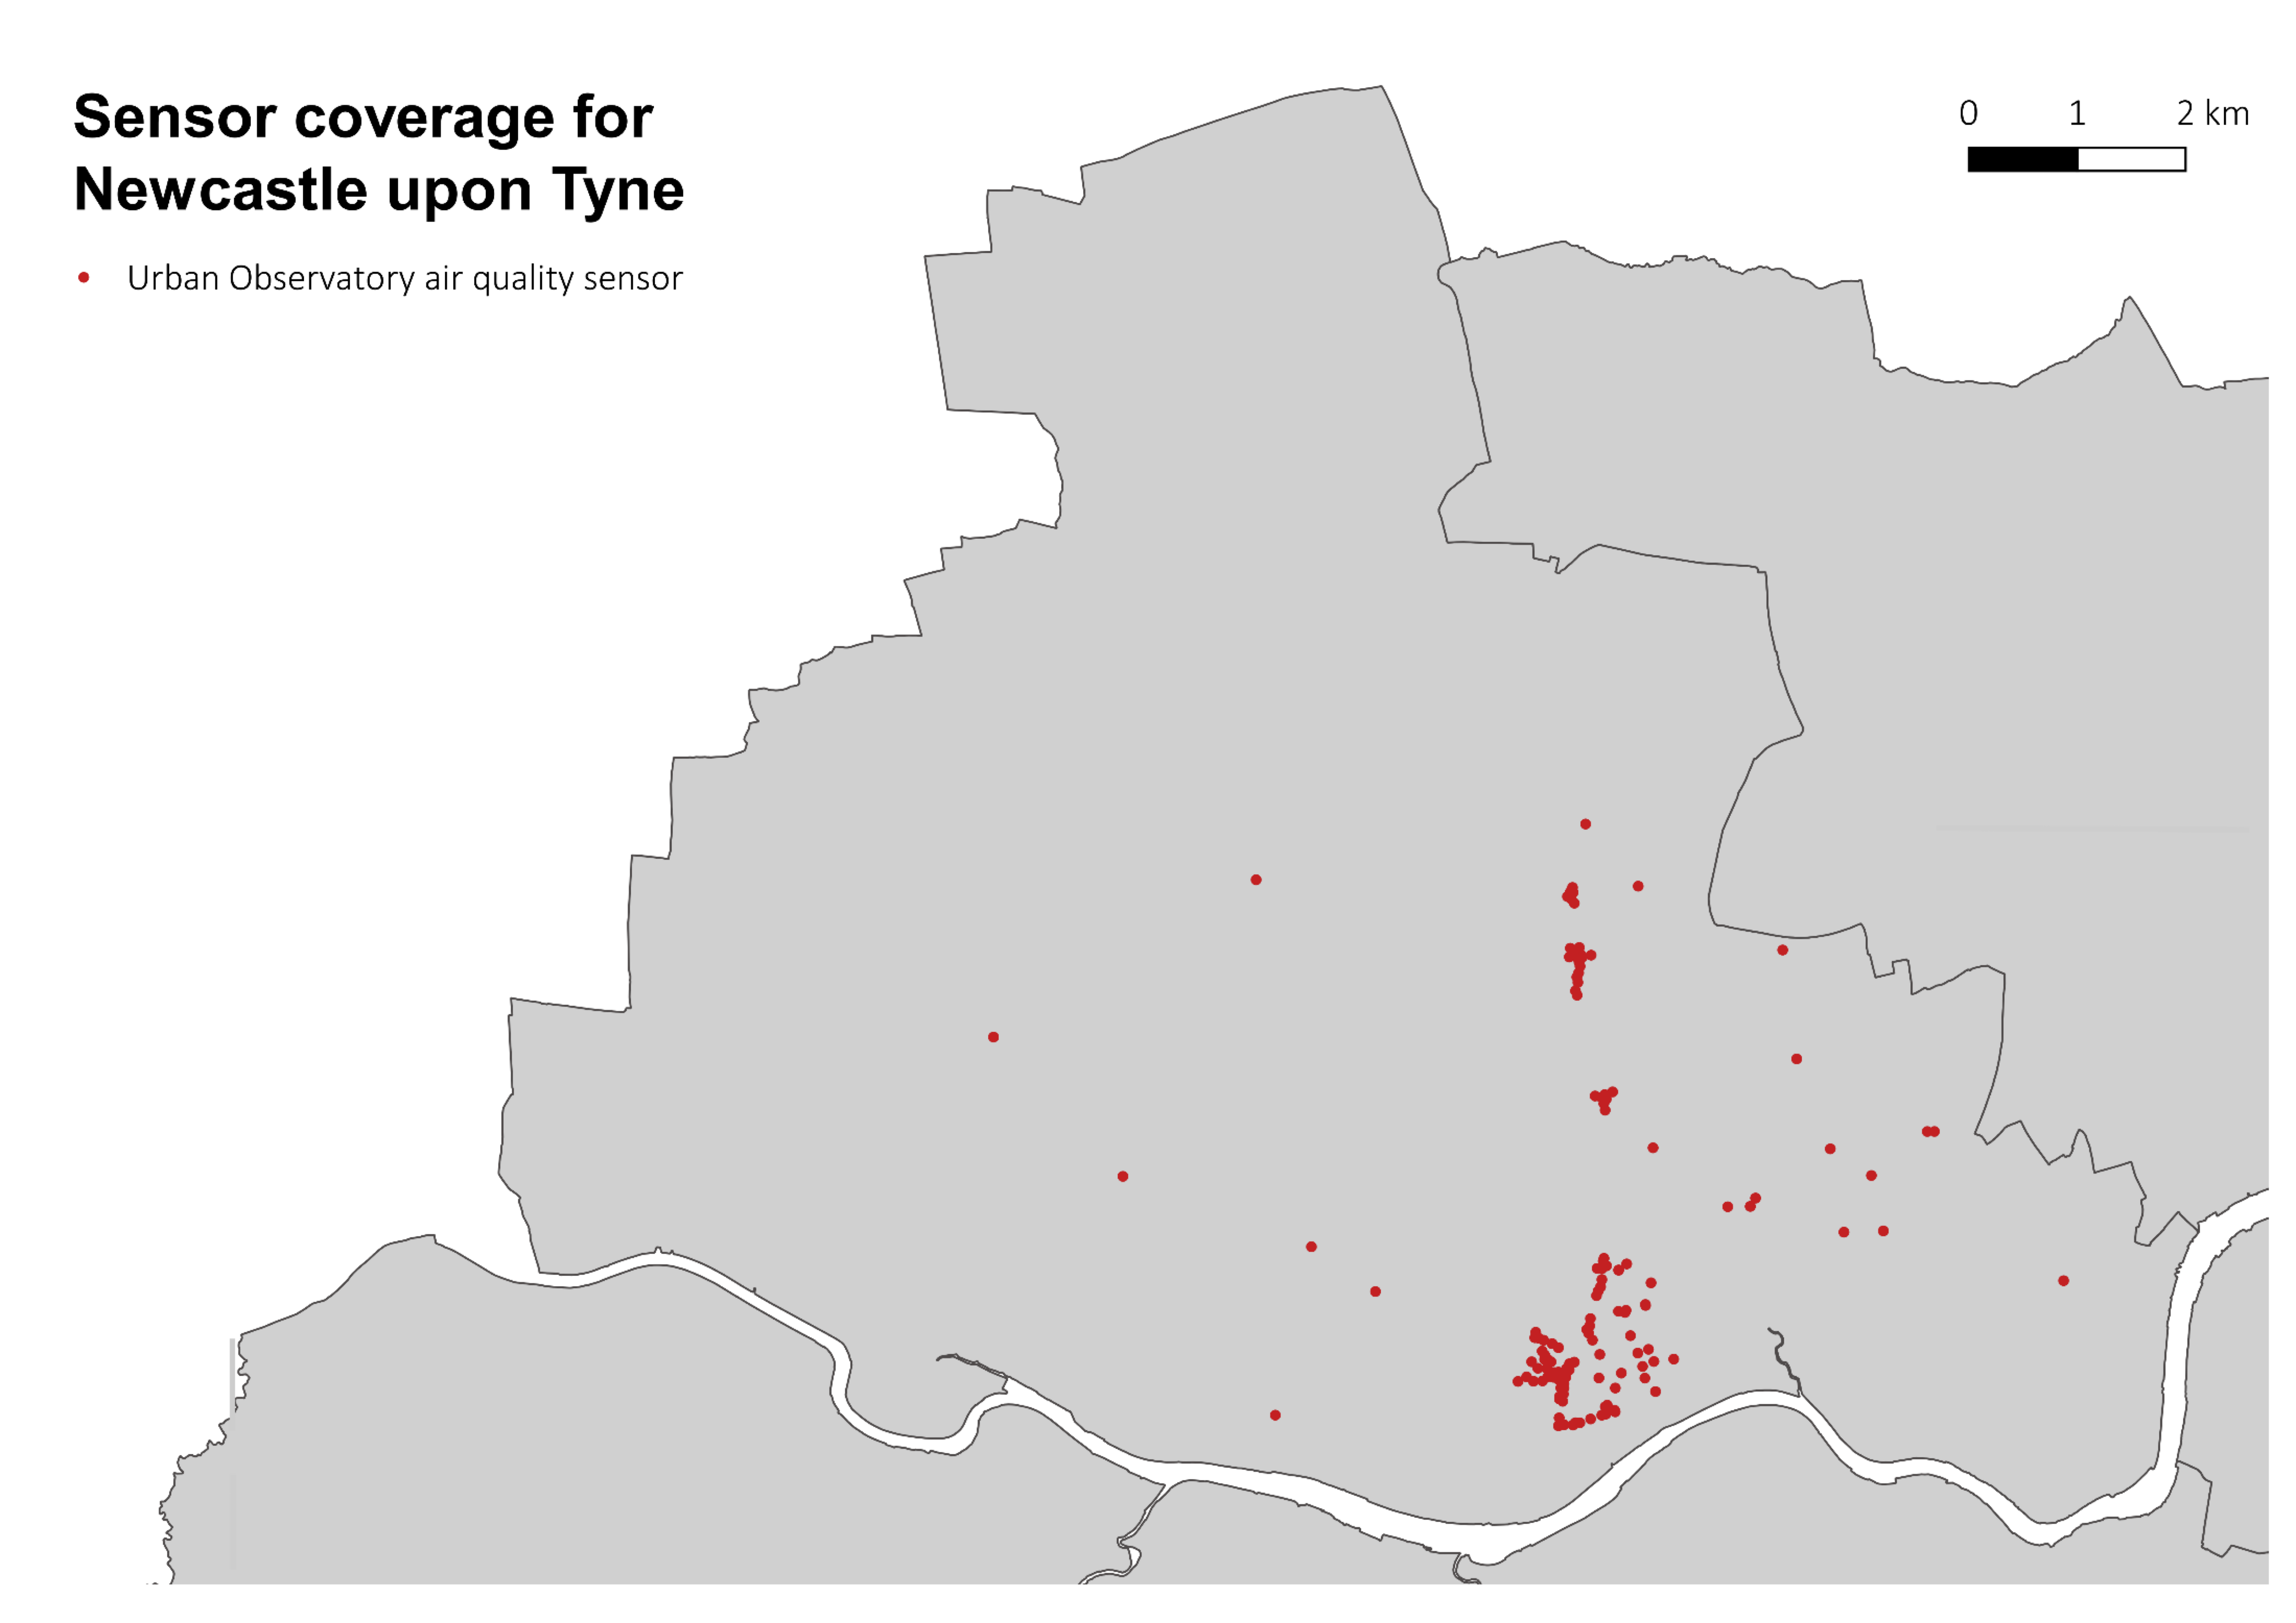
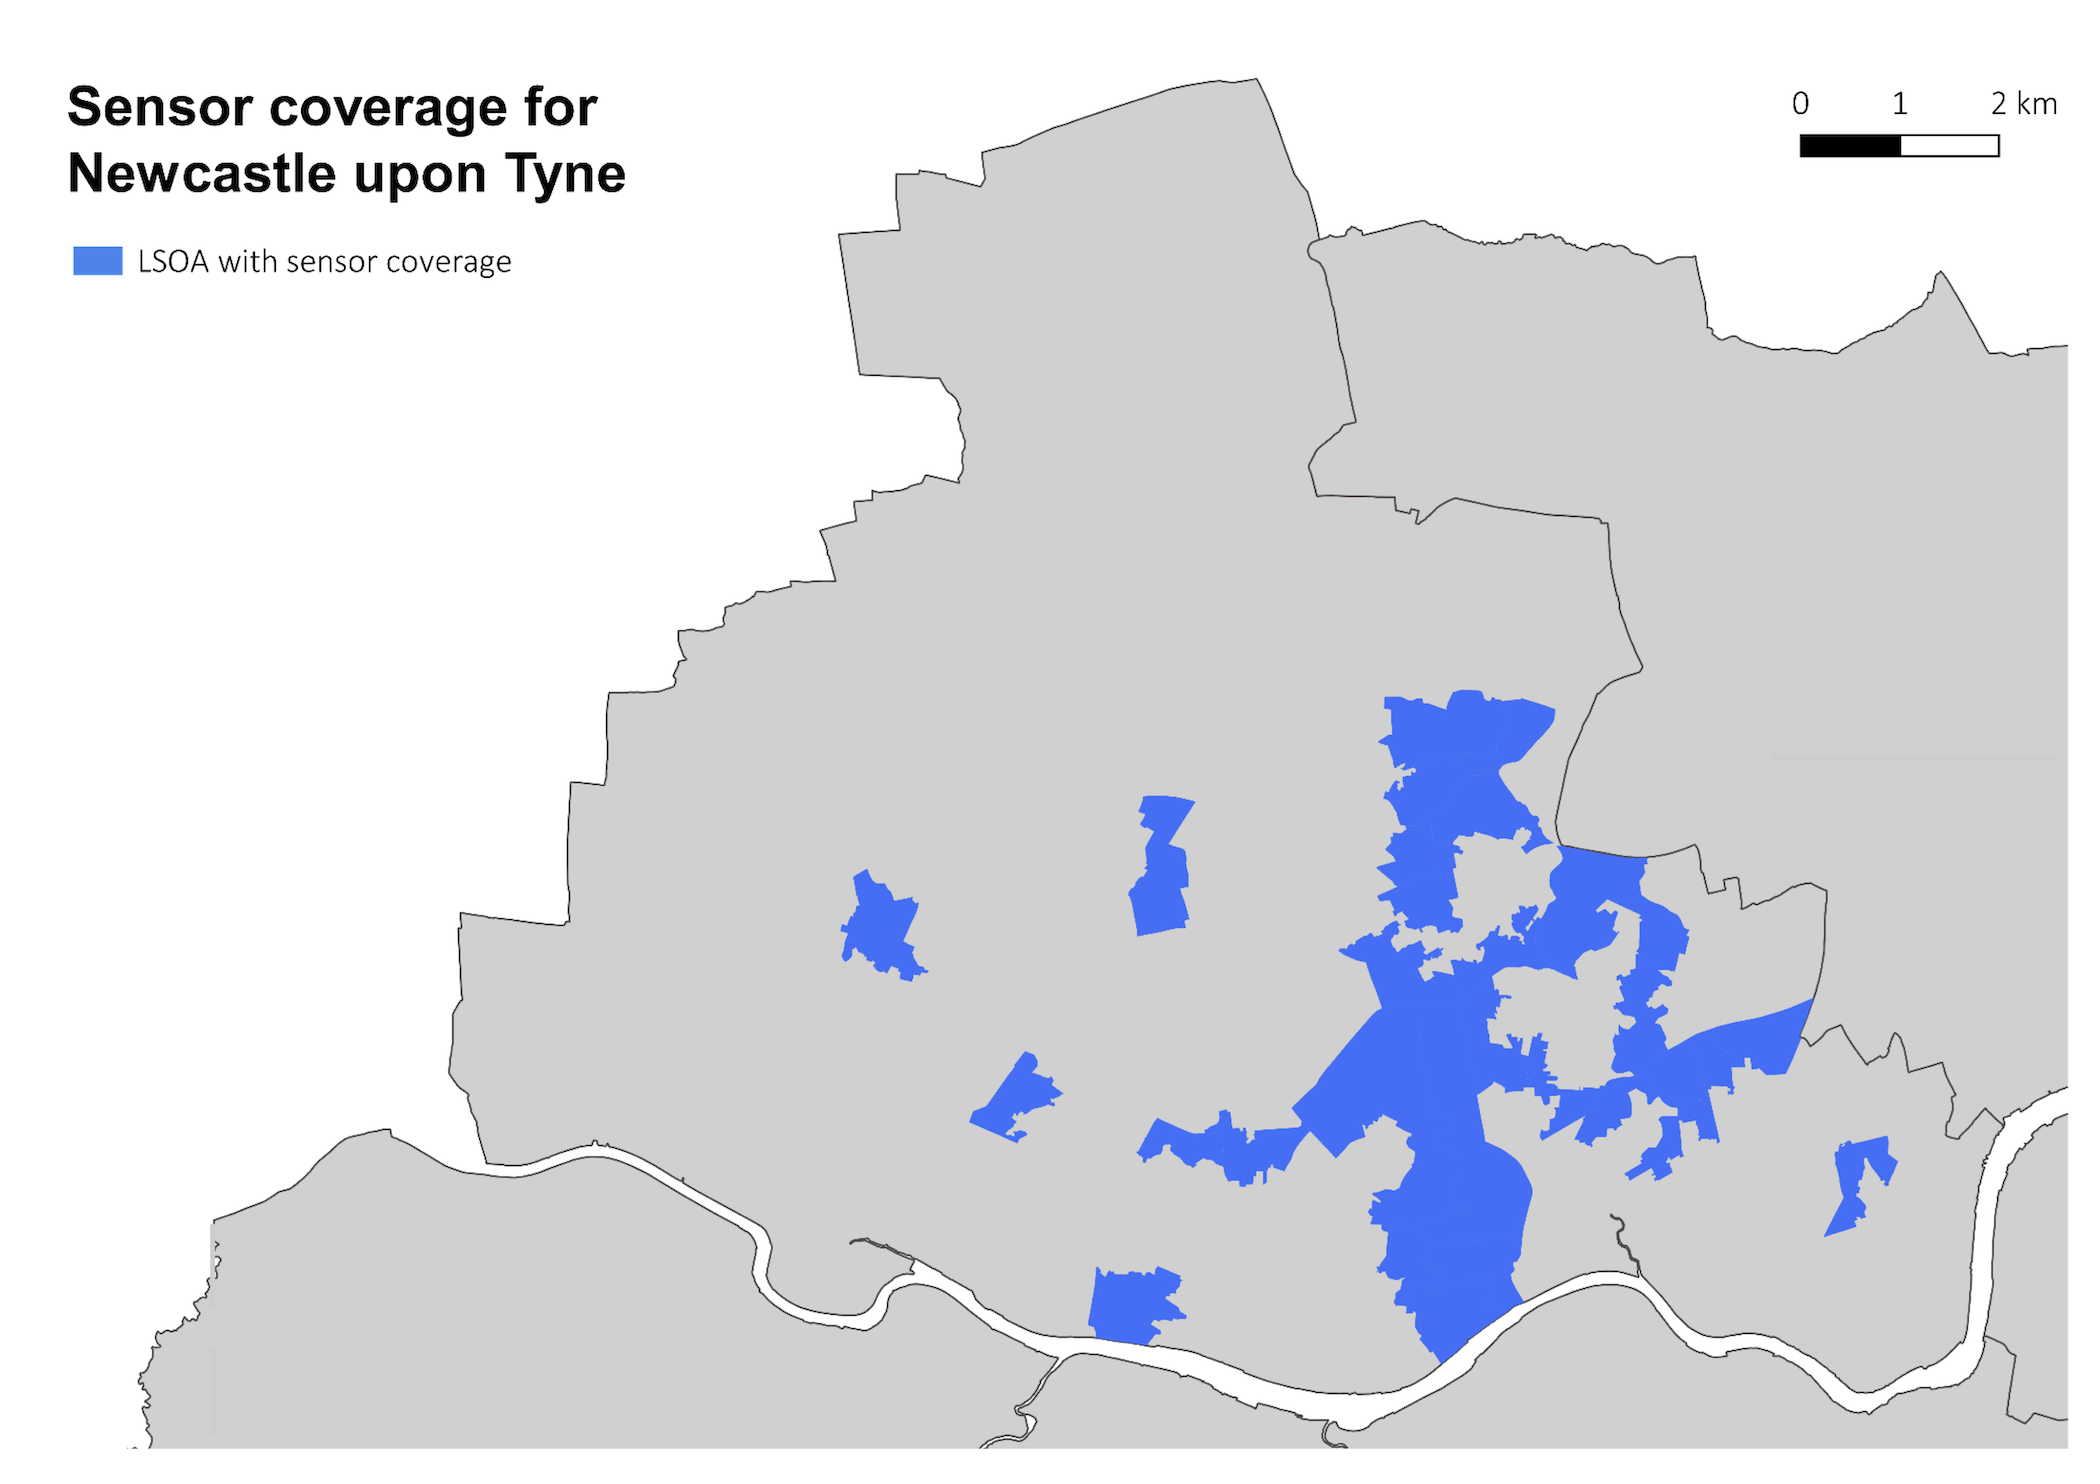
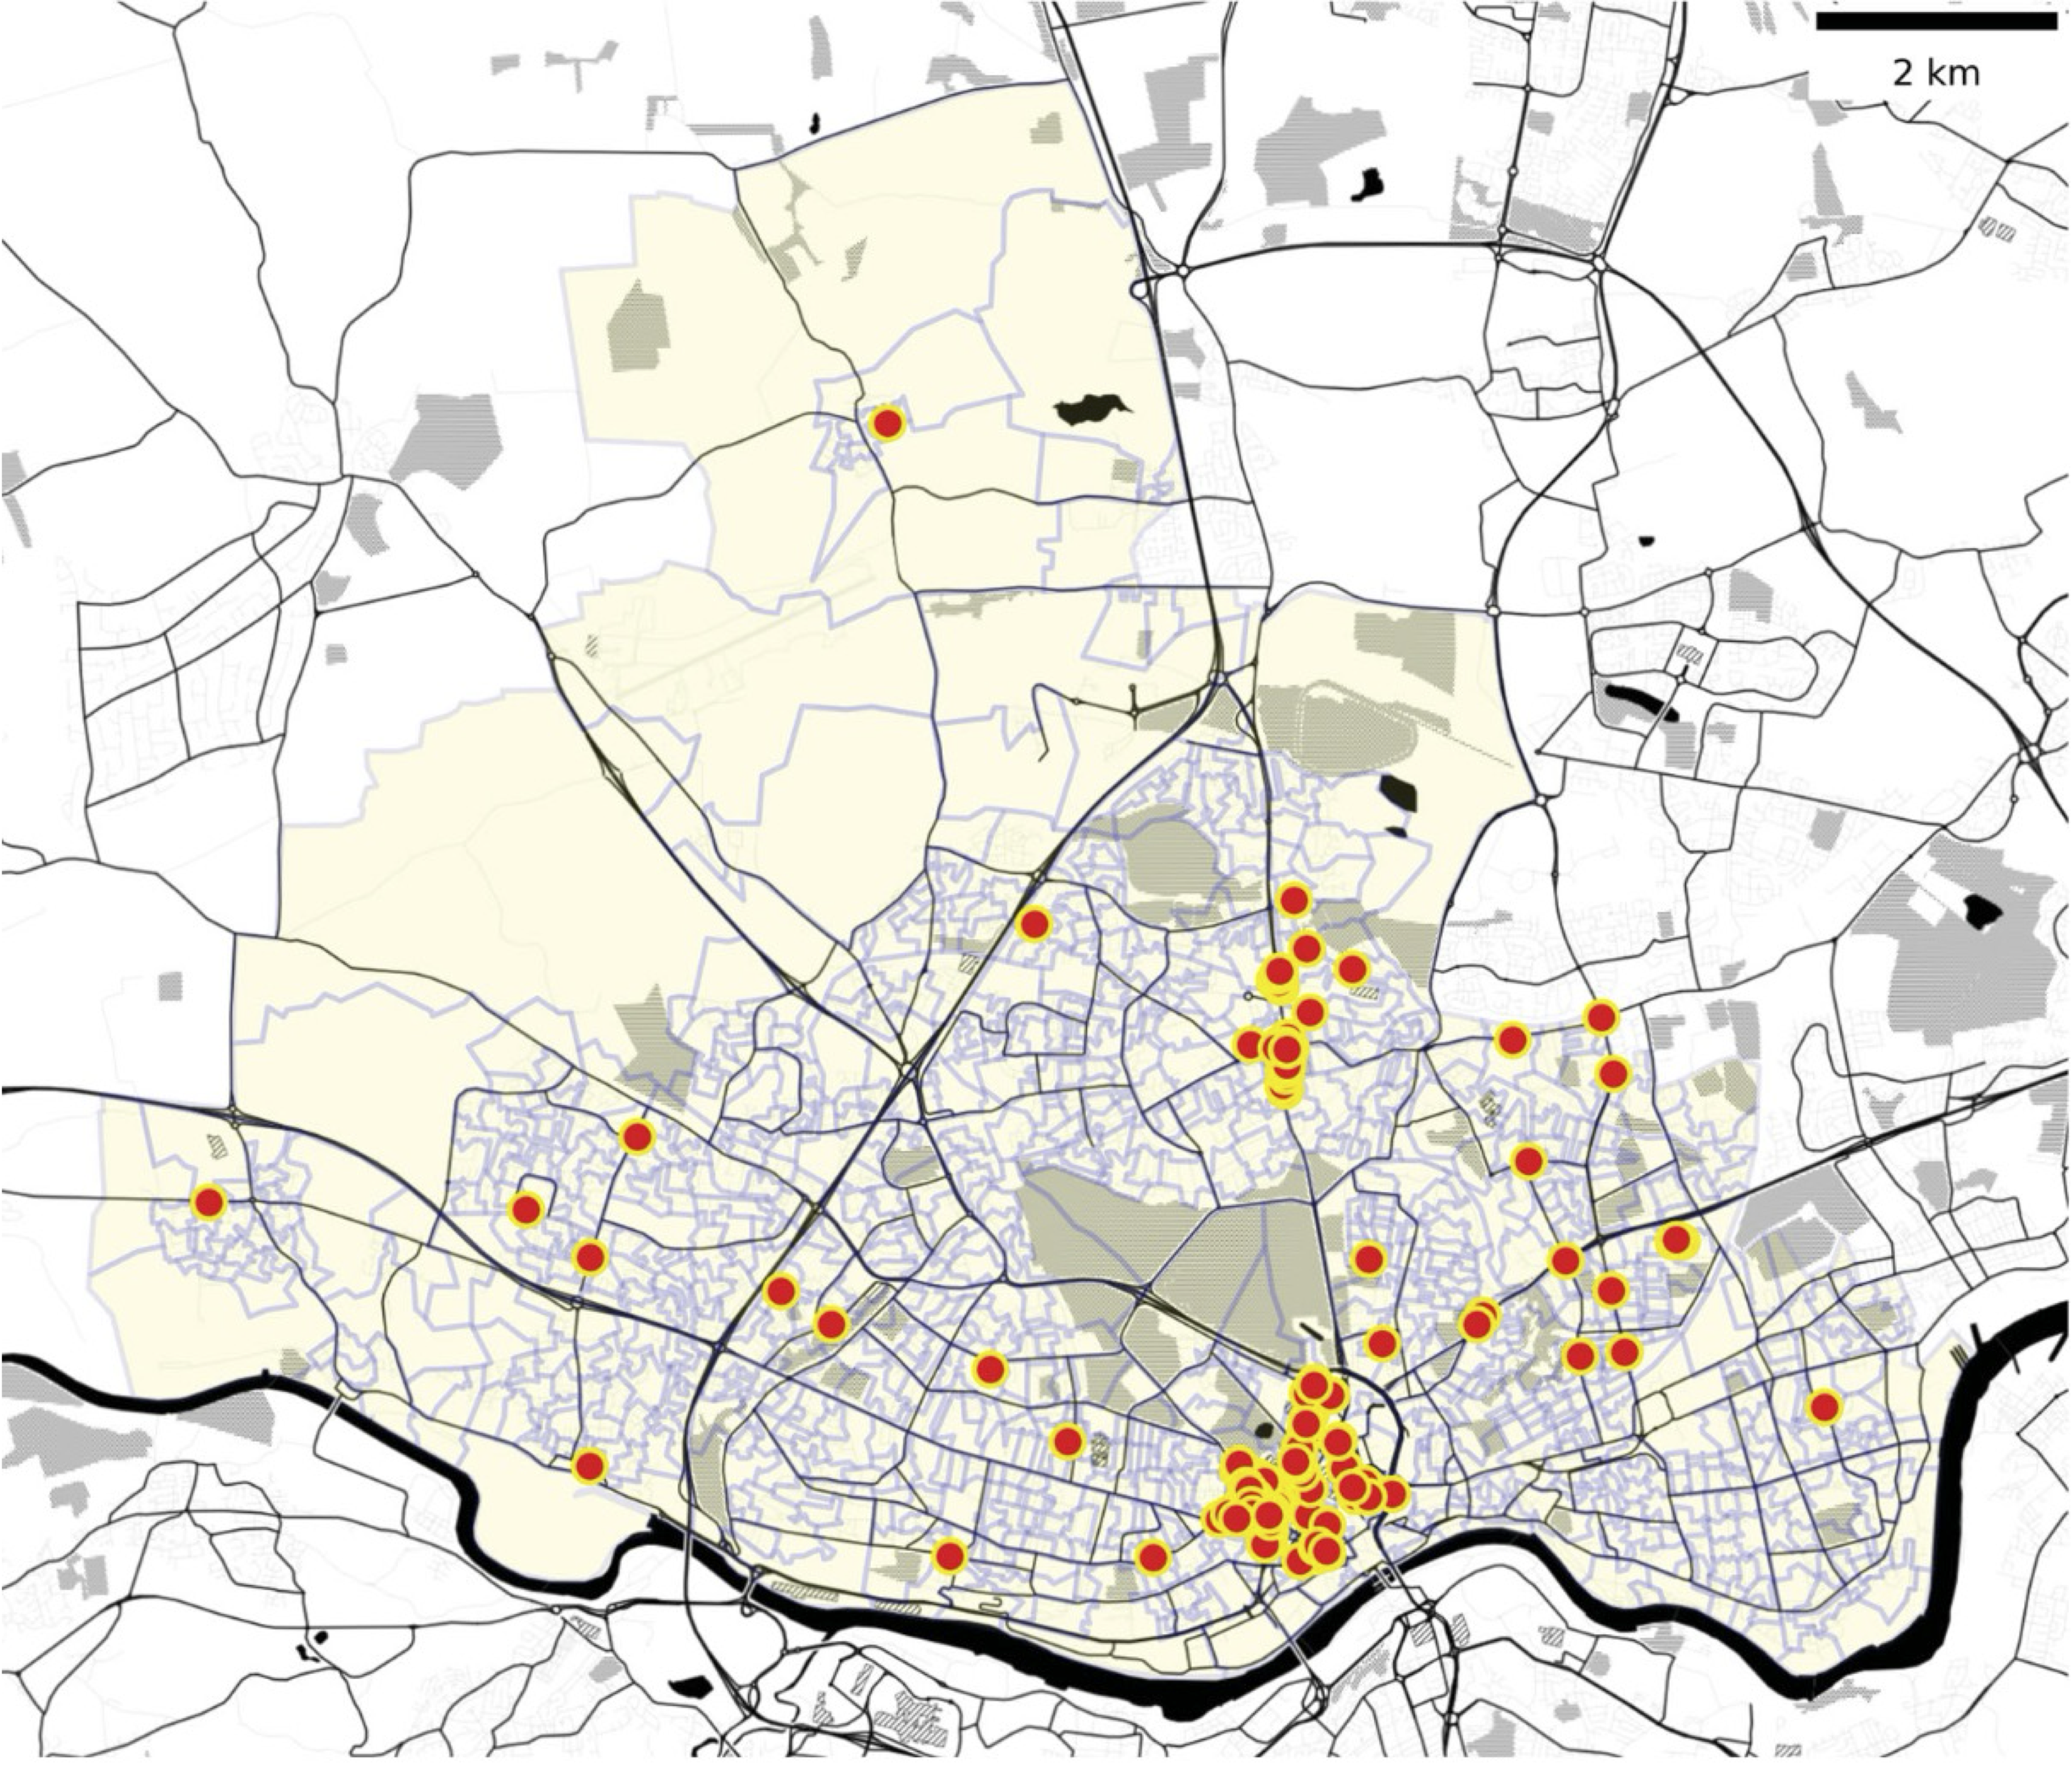
146 Urban Observatory sensors, located in 55 output areas
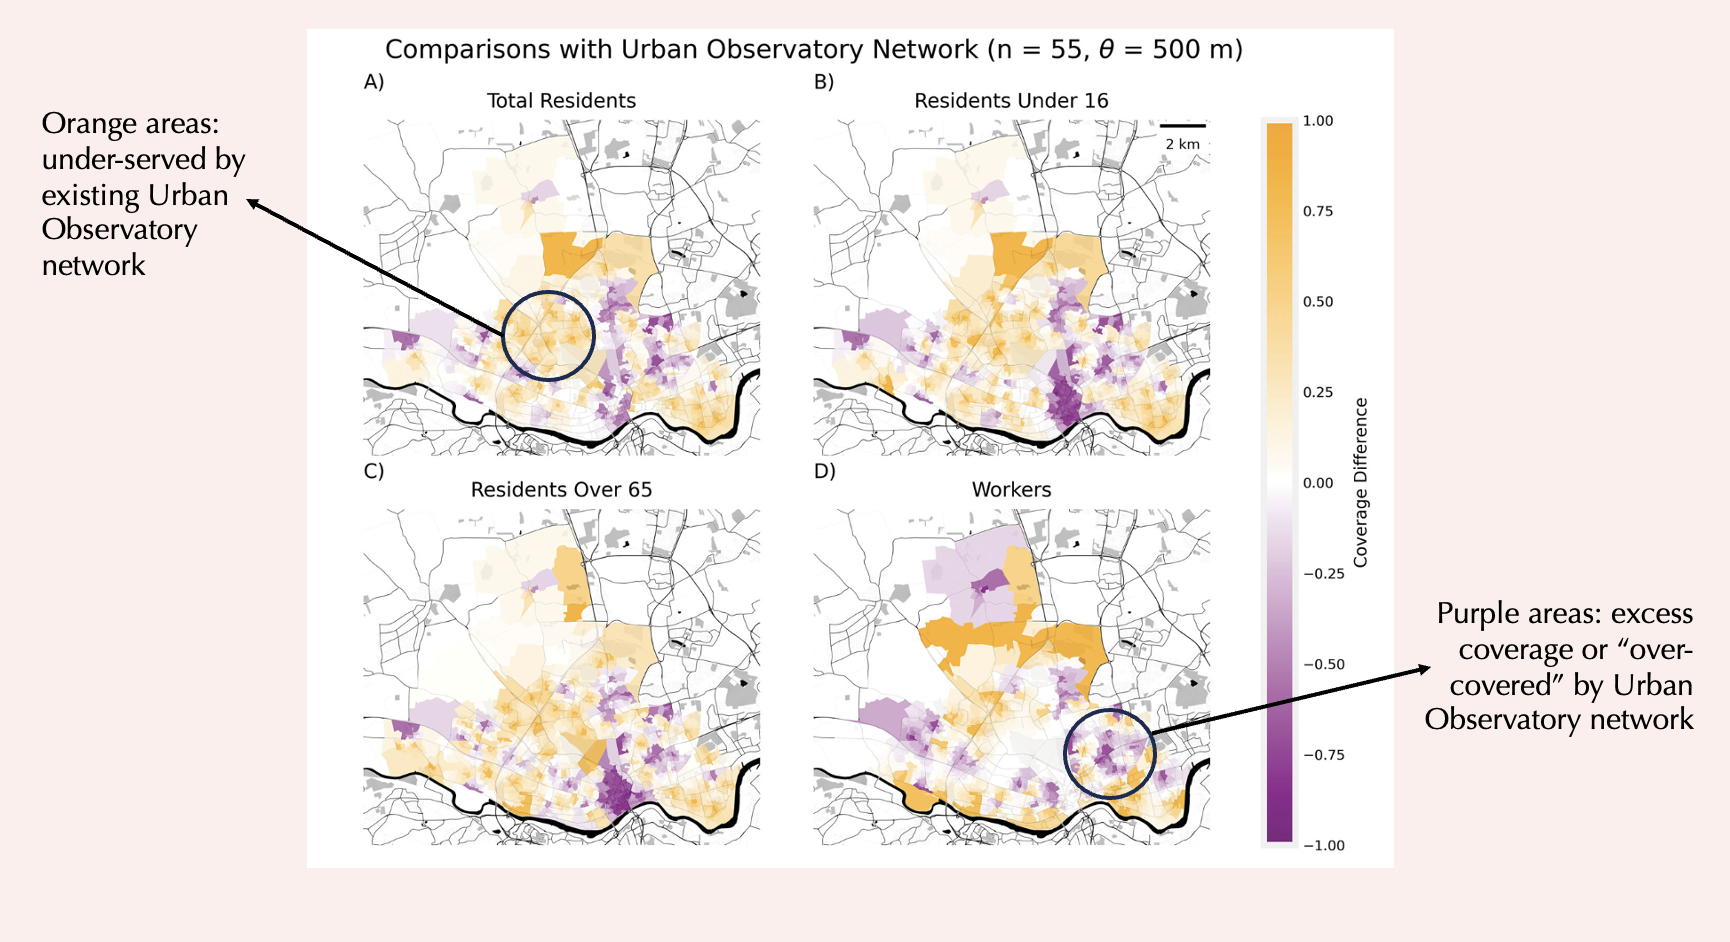
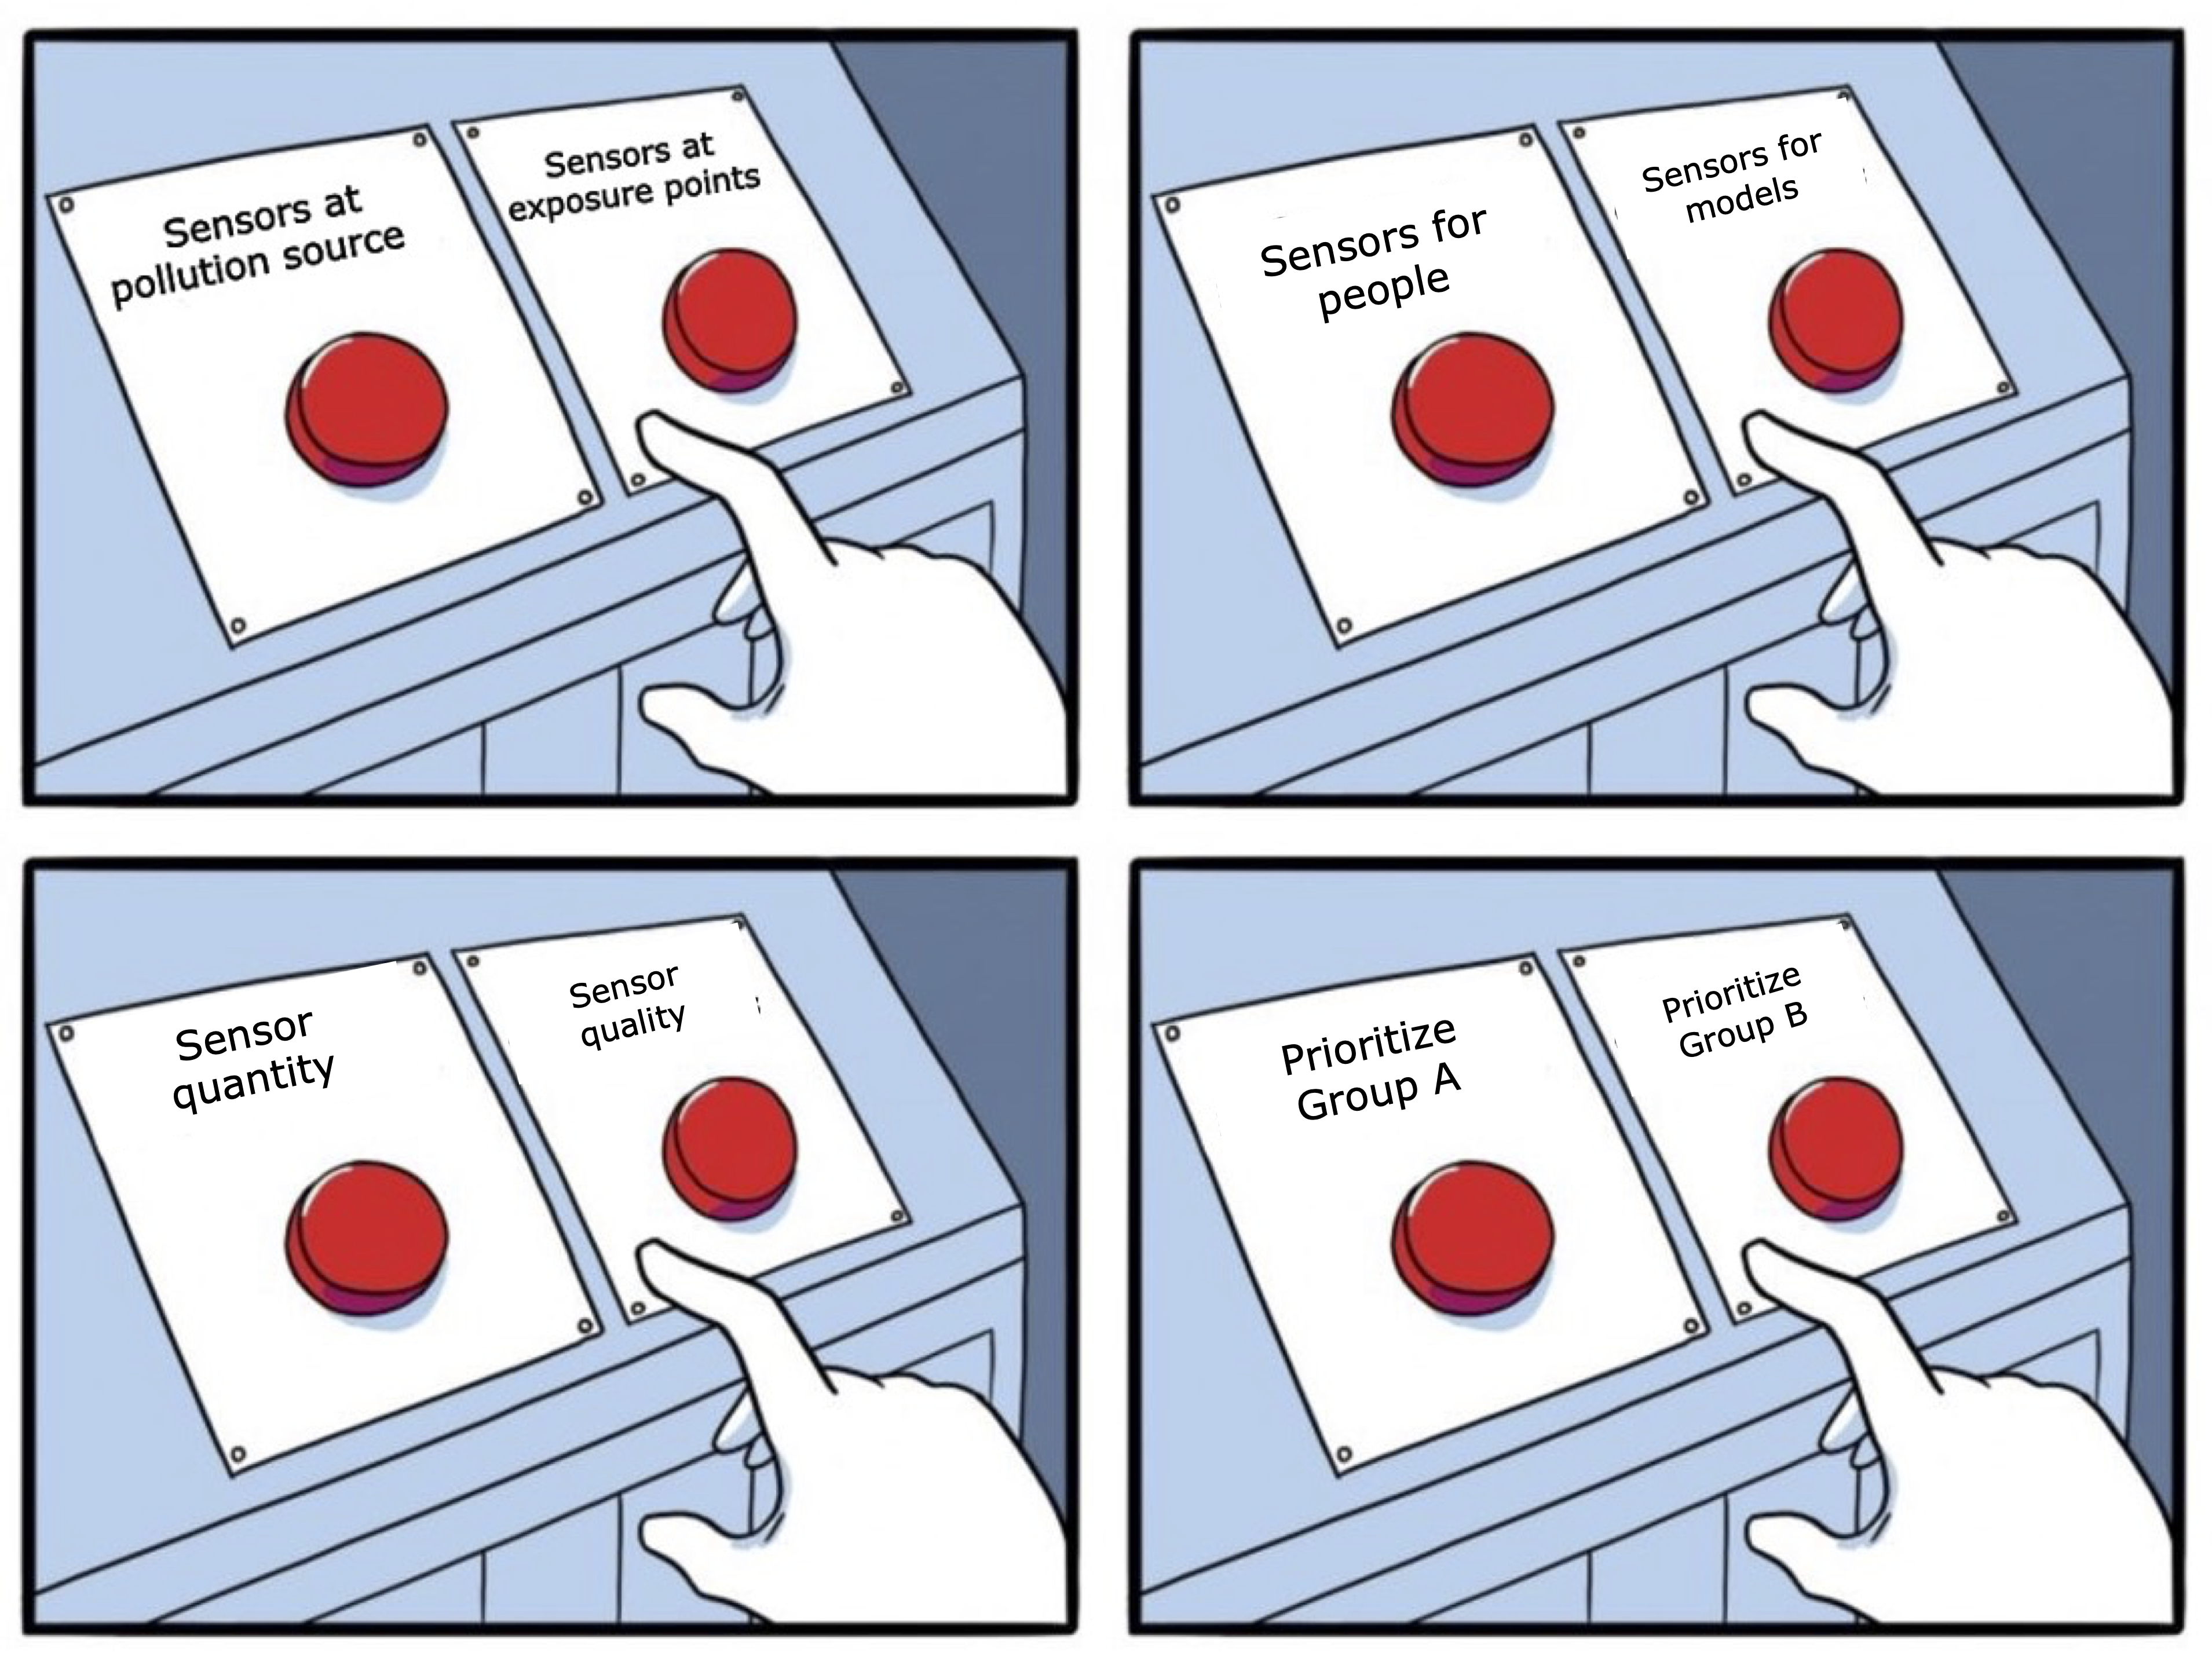
No fancy data here and well-known methods. But should make us think:
how are our data produced?
how can we do better?
University of Cambridge City Seminars | 25 February 2025